iShares MSCI United Kingdom EFT (EWU)
Key Statistics
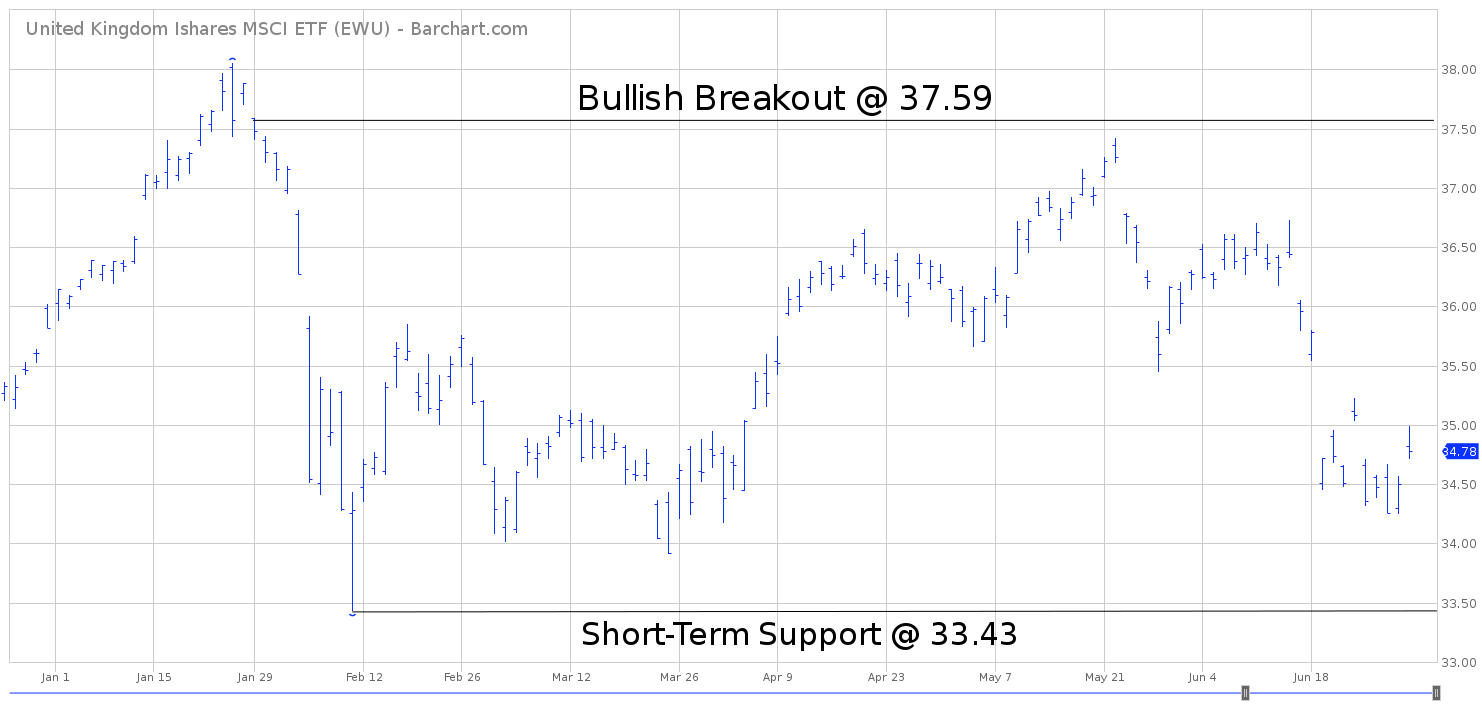
Thank you for reading this post, don't forget to subscribe!Minor Support Level 33.43 Minor Resistance Level 37.59
Major Support Level 23.72 Major Resistance Level 48.60
Minor Buy Signal 39.12 Minor Sell Signal 32.29
Major Buy Signal 52.98 Major Sell Signal 20.78
BRIEF OVERVIEW
June 23, 2016 marked one of the most important days in the history of the British economy. In a fairly close outcome (51.9% to 48.1%), the United Kingdom voted to leave the European Union (EU). This was a landmark decision by the UK because it marks the first time that a participating member state has left the EU since its original founding in 1951. How will this decision by the United Kingdom affect the future direction of its economy and its level of importance on the global economic stage? Let’s examine the details.
Before we examine UK economy, let’s briefly review the history of the European Union. This will give us an idea of what exactly the United Kingdom is leaving behind by removing itself from the EU.
Many investors believe the European Union was formed in 1999, with the introduction of the Eurocurrency (more popularly known as the Euro). This is not true. As we mentioned briefly, the EU was formed in 1951, officially known as the European Coal and Steel Community (ECSC). The original six members were Belgium, France, Italy, Luxembourg and West Germany.
In an effort to expand the economic well-being of its member states, the European Economic Community (EEC) was formed in 1957. In 1993, the EEC was rebranded as the European Community (EC). Finally, in 1999, the EC joined forces with other member states to form the European Union (EU). This is also when the Euro was unveiled as the official currency of the EU (although not all member states adopted the Euro). Please review the following table.
European Union
Member States
Member State Member State Member State
Austria Belgium Bulgaria
Croatia Cyprus Czech Republic
Denmark Estonia Finland
France Germany Greece
Hungary Ireland Italy
Latvia Lithuania Luxembourg
Malta Netherlands Poland
Portugal Romania Slovakia
Slovenia Spain Sweden
United Kingdom
Officially, the UK is a member of the European Union until March 29, 2019. Currently, the UK is in the process of working with the EU in order to implement a smooth transition as the exit date approaches.
The iShares family of exchange traded funds (owned by BlackRock) launched the MSCI United Kingdom ETF on March 12, 1996. The ticker symbol is EWU. This ETF is a perfect vehicle for investors who are searching for exposure to companies who generate their revenue from the UK economy. EWU has 103 different holdings. The top five holdings include HSBC, Royal Dutch Shell, BP LLC, British American Tobacco and GlaxoSmithKline.
SHORT-TERM VIEW
2018 has been a rather uneventful year for EWU. During the past six months, the ETF has essentially been locked in a trading range between 33 and 38. Currently, the momentum is slightly in favor of the bearish camp. A weekly close below 33.43 would increase the bearish momentum.
The bulls need a weekly close above 37.59 in order to reverse the momentum. Based on the current momentum indicators, EWU could go in either direction over the course of the next six months. The ETF could easily remain range-bound for the remainder of 2018.
LONG-TERM VIEW
Although it’s much too early to know the true economic ramifications of the 2016 Brexit vote, most analysts agree that the UK economy will be negatively impacted going forward. Let’s review a few of the numbers. Please review the following table.
United Kingdom
Gross Domestic Product
Date %GDP Date %GDP Date %GDP
2000 3.7% 2001 2.5% 2002 2.5%
2003 3.3% 2004 2.4% 2005 3.1%
2006 2.5% 2007 2.4% 2008 0.5% (-)
2009 4.2% (-) 2010 1.7% 2011 1.5%
2012 1.5% 2013 2.1% 2014 3.1%
2015 2.3% 2016 1.9% 2017 1.8%
2018 1.5% (*)
(*) IMF Forecast
Source CountryEconomy
As you can see from the table, Brexit is already having a negative effect on the UK economy (even though it doesn’t become official until March 29, 2019). In 2017, the United Kingdom experienced its lowest rate of economic growth in five years. 2018 is projected to be even worse. Why is Brexit causing the UK economy to slow down? More importantly, what did voters gain by agreeing to leave the European Union?
Economically speaking, the root cause of the country’s slow growth is its loss of tariff-free trade status with the other EU members. This is the driving force which will prevent an increase in economic activity throughout 2018 and 2019.
Generally speaking, tariffs raise the cost of exports. Consequently, UK companies will find themselves at a competitive disadvantage because their goods and services will be priced at a higher level (as a direct result of the tariff). Additionally, import prices will increase, which will allow domestic companies inside the UK to raise their prices. Of course, these higher prices will trickle down to consumers, which will ultimately lower their standard of living.
Quite possibly, the industry that will face the greatest disruption will be the financial services industry. London’s financial district (more commonly known as The City) will no longer be the base for companies that use it as an English-speaking entry into the EU economy. Real estate owners and developers are concerned that there could be a mass exodus of firms leaving The City beginning in 2019. In fact, the transition away from London’s financial district may have already begun. Several real estate projects have been placed on hold until financial firms have a more clear understanding of how Brexit will change The City. There is a very real possibility that the financial services industry could move elsewhere. Consequently, real estate prices could plummet.
In addition to the financial services industry, the UK construction industry could also suffer as a result of Brexit. Currently, UK construction companies have the ability to bid on public contracts in any EU country. However, after March 29, 2019, UK companies will no longer have access to these potentially lucrative contracts.
UK companies involved in the travel and leisure industry are also concerned about the ramifications of Brexit, particularly as it relates to Ireland. Northern Ireland will remain with the UK, while southern Ireland remains part of the EU. The beautiful island of Ireland is a major vacation destination for UK citizens. However, it will certainly be more difficult for UK travel companies to promote Ireland as a vacation getaway once Brexit becomes official.
In terms of major advantages, the UK will be relieved of the burden of allowing the free flow of people into the United Kingdom from all other EU member countries. In fact, this is the main reason why UK citizens voted in favor of Brexit. They were concerned about an increase of refugees from Africa and the Middle East.
An additional Brexit benefit is the UK government’s ability to levy taxes without following EU guidelines. As an added bonus, the United Kingdom won’t have to pay EU membership fees.
At this point, it’s much too early to accurately determine how Brexit will change the economic landscape in the UK. The true ramifications won’t be realized at least for another decade. However, it’s safe to say that Brexit will certainly cause many economic disruptions as the UK eventually moves beyond the official Brexit date in 2019.
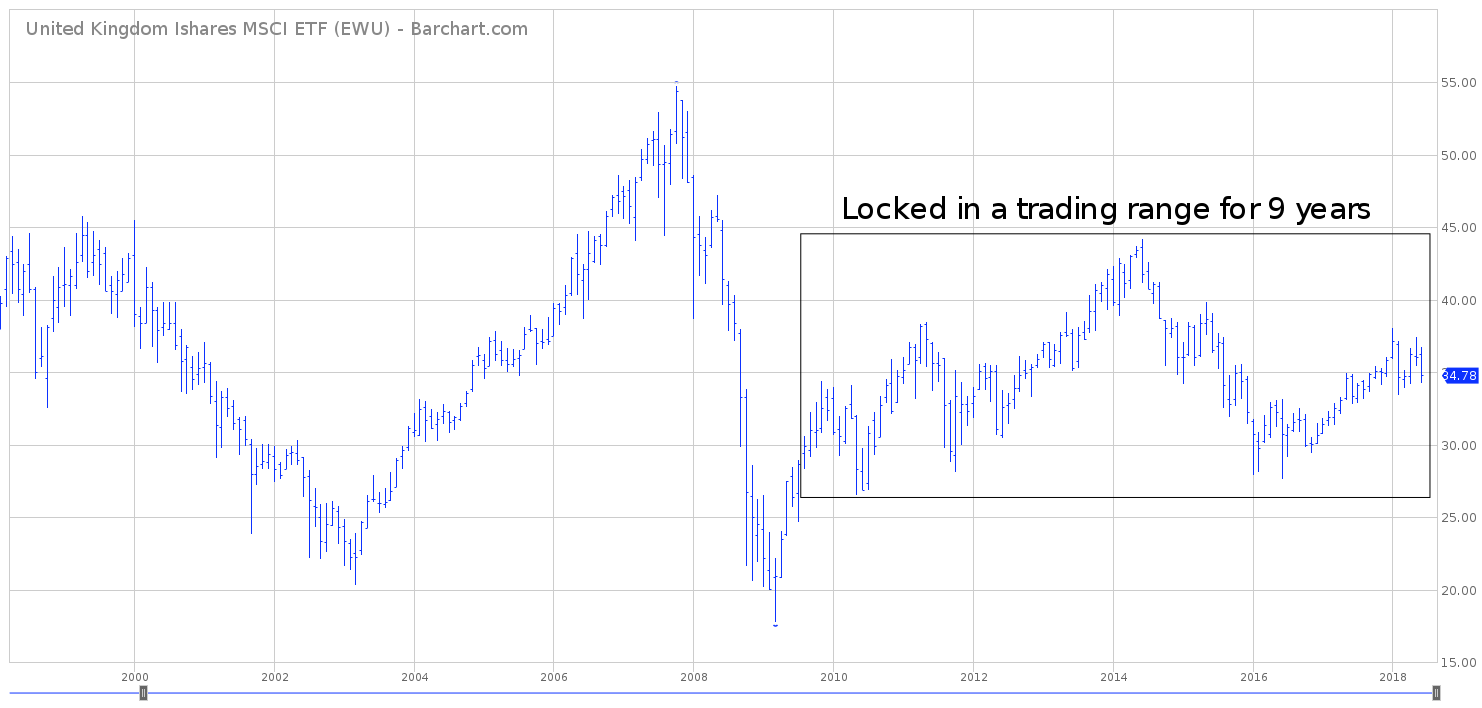
In regard to the long-term momentum, EWU has been locked in a trading range for the past nine years. With the exception of a few months, EWU has been trading between 30 and 40 since the summer of 2009. The momentum will turn bullish on a weekly close above 48.60. A weekly close below 20.78 will swing the momentum in favor of the bears. Currently, the bears have a slight advantage.
SHORT-TERM TREND
Please review the 6-month chart of EWU. The chart pattern is beginning to roll over to the downside in favor of the bearish camp. A weekly close below 33.43 would accelerate the move to the downside. A short-term bullish breakout would occur on a weekly close above 37.59.

LONG-TERM TREND
Please review the 20-year chart of EWU. As the official Brexit date approaches in March 2019, it should come as no surprise that EWU has been trading sideways of late. In fact, one could argue that the ETF has been range-bound for the better part of the past decade.
EWU is one of the few securities that generated a multi-year high and multi-year low in the course of less than two years. The ETF recorded its all-time high in October 2007 @ 54.76. Eighteen months later (March 2009), EWU generated an all-time low @ 17.76.
During the past nine years, EWU has frustrated both the bulls and the bears by drifting sideways between 30 and 40. Most likely, investors can expect more of the same until the financial community can gain a better understanding of the economic realities of Brexit.
In terms of specific numbers, the long-term chart pattern will turn bullish on a weekly close above 48.60. Conversely, a weekly close below 20.78 will produce a bearish chart pattern. EWU could easily continue to remain range-bound for the next 12 to 18 months.
Although EWU is currently in neutral territory, a slight edge must be given to the bearish camp. Going forward, Brexit will cause a great deal of uncertainty for the UK economy. Wall Street hates uncertainty. Therefore, the most probable outcome is an eventual breakout to the downside.