

PowerShares DB US Dollar Index Bullish Fund ETF (UUP)
Key Statistics
Thank you for reading this post, don't forget to subscribe!Daily Close 23.72 Long-Term Trend (100 SMA) Bearish
Minor Support Level 23.09 Minor Resistance Level 23.98
Major Support Level 20.84 Major Resistance Level 26.83
Minor Buy Signal 24.46 Minor Sell Signal 22.45
Major Buy Signal 27.19 Major Sell Signal 19.05
BRIEF OVERVIEW – US Dollar Index ETF UUP
According to the International Organization for Standardization (ISO), there are 185 different currencies in circulation. Without question, the most important currency is the US Dollar. It is the only currency that is accepted for trade throughout all countries of the world. Unofficially, the US Dollar is the reserve currency for all major central banks. It accounts for 64% of all central bank foreign exchange reserves.
Many financial experts and foreign currency analysts predict the US Dollar will eventually lose its reserve currency status. Based on the overwhelming popularity of the Dollar among the G20 nations, it’s highly unlikely the greenback will be dethroned as the global reserve currency. In fact, it’s almost impossible for another currency to replace the Dollar at the top of the currency hierarchy. Why? Because there simply are not enough paper currency notes in circulation outside of the US Dollar. The only other currencies that could even remotely compete against the greenback are the Euro and the Japanese Yen. However, both of these currencies have very little physical notes in circulation. Therefore, it would be logistically impossible for these currencies to replace the US Dollar.
Given the fact that the US Dollar will probably remain the global reserve currency for well into the future, it’s very important for traders and investors to accurately determine the long-term outlook for the greenback. The US Dollar has a huge influence in determining the future price direction of all asset classes. This includes stocks, bonds, commodities, precious metals, real estate and digital currencies.
In regard to the ETF universe, the most popular US Dollar ETF is the DB US Dollar Index Bullish Fund, which was launched by the PowerShares family of exchange traded funds. The date of inception is February 20, 2007. The ticker symbol is UUP. This is an excellent vehicle for investors who are searching for a cost effective way to track the value of the US Dollar relative to other global currencies. Specifically, UUP invests in a basket of six currencies. The list includes Euro FX, Japanese Yen, British Pound, Canadian Dollar, Swedish Krona and Swiss Franc.
SHORT-TERM VIEW – US Dollar Index ETF UUP
UUP has been drifting lower for the better part of 2018. It does appear that UUP formed a short-term bottom on January 25th @ 23.09. However, this is probably only a temporary bottom (to be followed by lower prices).
The bears are in control of the short-term momentum. The next level of support is the low established on January 25th. The bulls need a weekly close above 23.98 in order to capture the upside momentum. The most likely scenario is a continuation of lower prices.
Based on the Aroon Oscillator, UUP has a neutral reading of +28. The Aroon Oscillator is programmed differently than most stochastic indicators. The oscillator fluctuates between
-100 and +100. A reading of 0 would indicate a neutral position. Therefore, a reading of +28 with UUP is considered fairly neutral. The next big move could go either way.
LONG-TERM VIEW – US Dollar Index ETF UUP
In order to determine the long-term outlook of the US Dollar, the best place to start is by reviewing a multi-decade chart of the Dollar Index (USDX). This will provide us with a “big picture” view of the US Dollar over the course of the past 50 years.
Officially, USDX was created in March 1973. However, there exists verifiable data which dates back to April 1968. The index consists of a basket of foreign currencies, very similar to UUP. In fact, USDX and UUP are exactly the same in regard to their foreign currency holdings. The dominant currency is the Euro (57.6%), followed by Japanese Yen (13.6%), British Pound (11.9%), Canadian Dollar (9.1%), Swedish Krona (4.2%) and Swiss Franc (3.6%).
Please review the 50-year chart of USDX (Chart #1). Between 1980 and 1985, the Dollar appreciated over 50% against its basket of foreign currencies. A rise of 50% is considered a dramatic move in the world of foreign currencies. For example, most major currencies typically fluctuate 3% to 5% per year. Therefore, an increase of 50% in the early 1980s was an unprecedented move. In fact, the move was so large that it prompted the leaders from the G5 countries to implement a policy to reduce the value of the US Dollar.
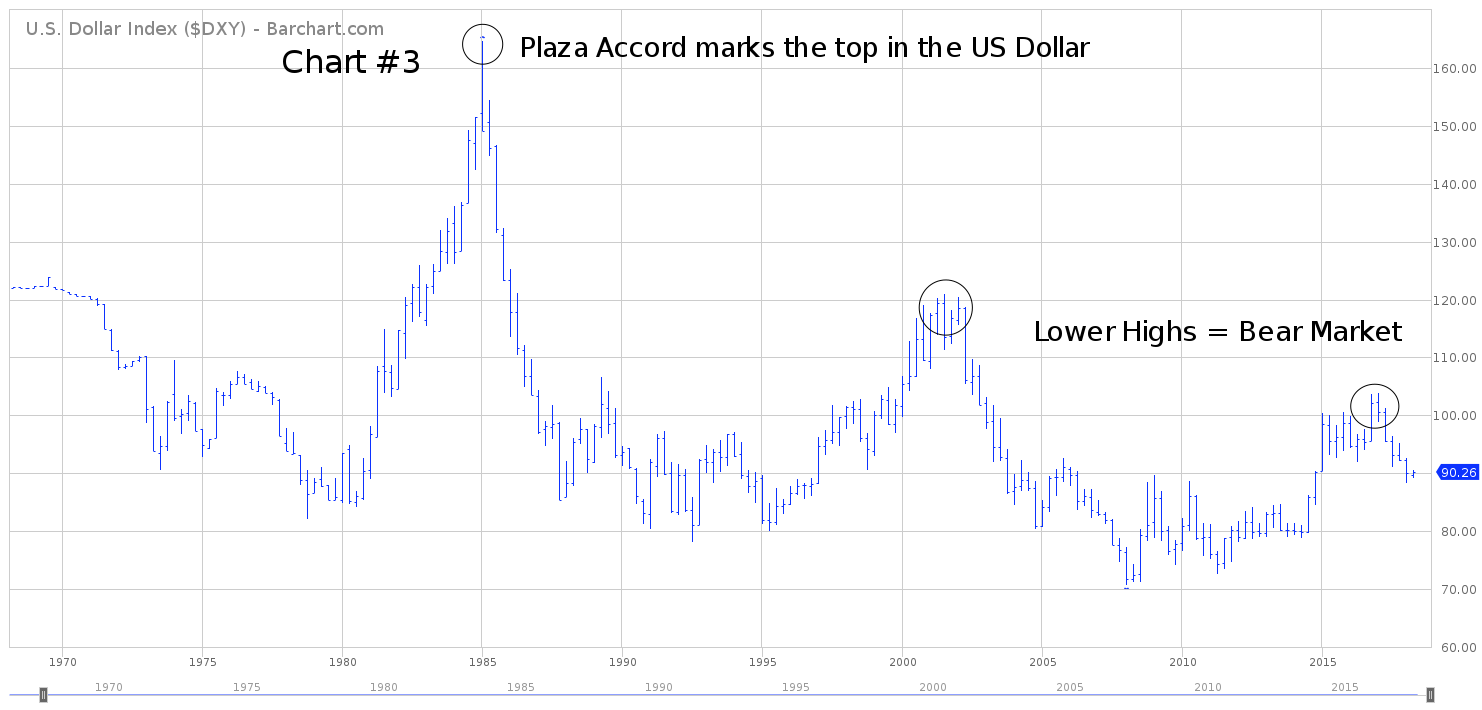
In September 1985, the leaders from the United States, West Germany, Japan, France and the United Kingdom met at the Plaza Hotel in New York. The sole purpose of the meeting was to establish a plan to systematically devalue the Dollar against the G5 currencies. The Dollar had increased so dramatically during the previous five years, that it was causing disruptions in the trade of goods and services between countries. Therefore, the value of the US Dollar was deliberately reduced in an effort to increase global economic activity. This historic meeting in New York became known as the Plaza Accord.
The Dollar Index recorded its all-time high in January 1985, @ 164.72. The peak occurred about eight months prior to the Plaza Accord. Many financial historians have argued that the currency agreement at the Plaza Hotel was unnecessary. They contend that market forces would have eventually lowered the value of the US Dollar without any type of intervention between the G5 countries. Most likely, this argument is correct. However, the Plaza Accord certainly accelerated the decline of the Dollar. Overall, the plan was very successful in its attempt to increase global economic activity.
The US Dollar has never recovered from its peak just prior to the Plaza Accord. Essentially, the Dollar Index has been drifting lower for the past 33 years. Of course, there have been several rallies during the past few decades. However, USDX has never even came close to reaching its level from 1985. This is a classic example of a secular bear market (lower highs and lower lows).
Many experts within the foreign currency community claim that the US Dollar is manipulated and controlled by the major central banks of the world. From a global economic standpoint, they argue that a weak US Dollar is beneficial for all countries. Therefore, the Dollar is prevented from rising in order to promote international trade. Of course, it’s impossible to prove that the Dollar is being manipulated by central banks. However, it does seem rather strange that USDX has never exceeded its all-time high from 1985.
Given the dramatic increase in popularity of digital currencies during the past few years, it is quite possible that the entire fiat currency system will experience major changes during the next 5 to 10 years. The US Dollar could easily be combined with other fiat currencies to create some type of global currency. Most likely, today’s global currency system will look completely different ten years from now.
The long-term view of UUP is definitely bearish. The next level of support is 20.83. In order to recapture the momentum, the bulls need a weekly close above 26.83. UUP enjoyed a strong rally between 2014 and 2016. However, the rally came to an abrupt end beginning in 2017. Going forward, the most likely scenario is a continuation of lower prices.
SHORT-TERM CHART – US Dollar Index ETF UUP
Please review the 6-month chart of UUP (Chart #2). The ETF has been trading sideways during the first four months of 2018, with a slight bias to the downside. Most likely, UUP formed a short-term bottom on January 25th @ 23.09. However, this is probably only a temporary bottom (to be followed by lower prices). At least for now, the short-term chart pattern is neutral.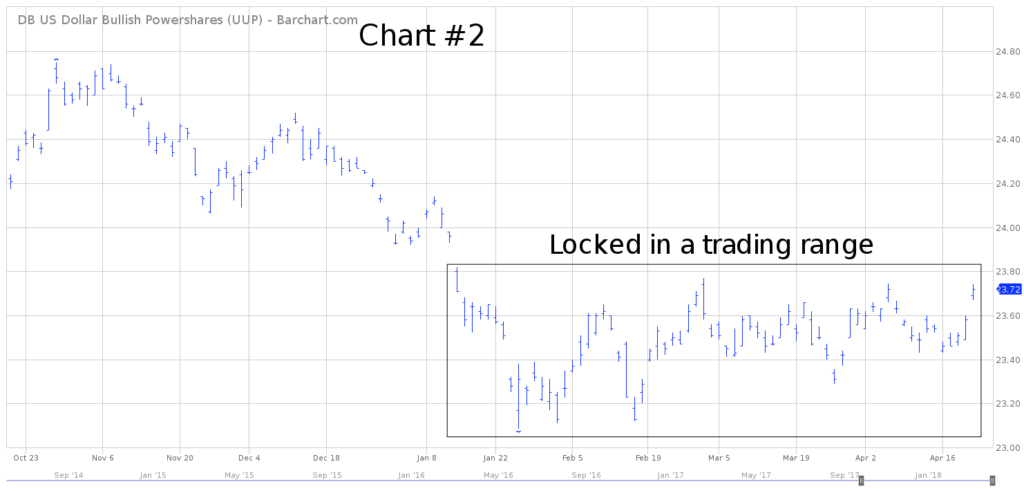
LONG-TERM CHART – US Dollar Index ETF UUP
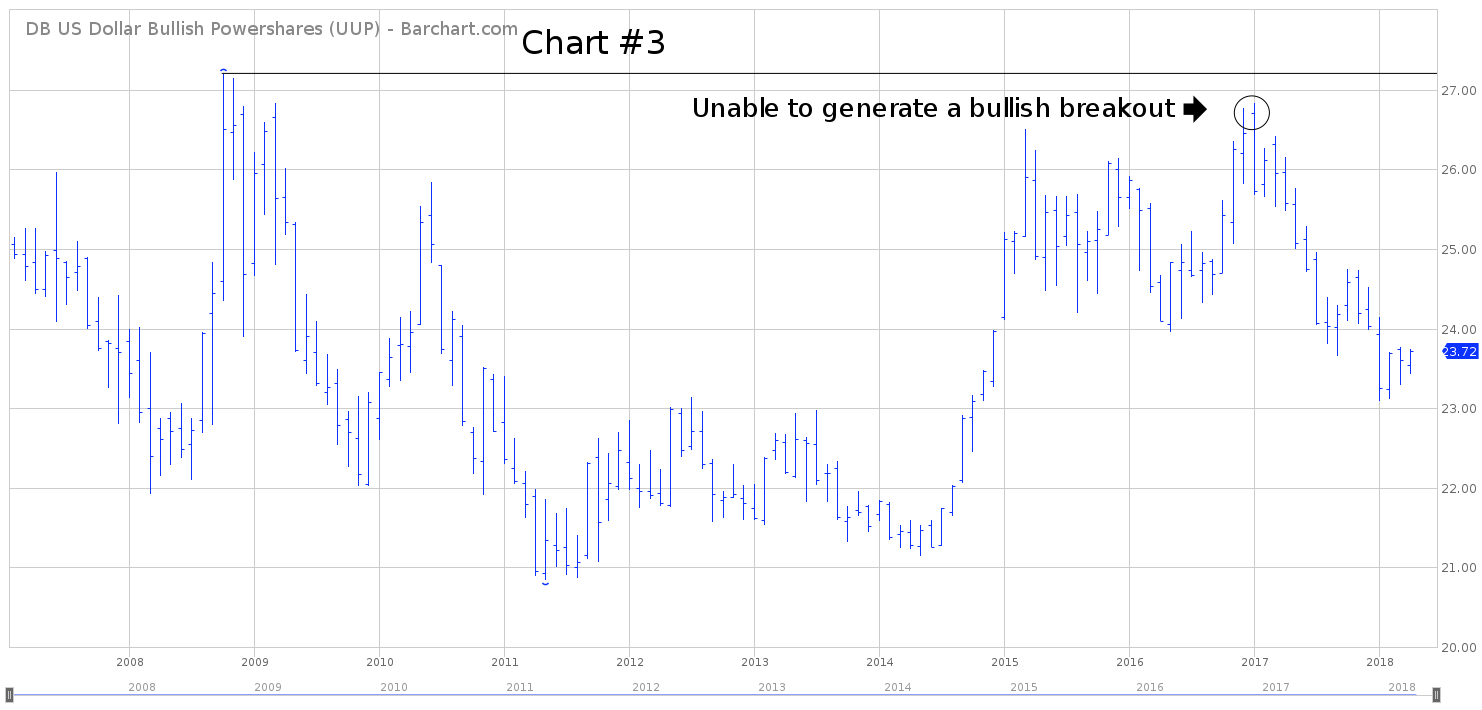
Please review the 11-year chart of UUP (Chart#3). This chart covers the entire trading history of UUP. The bears are in control of the long-term chart pattern. The bulls made an effort to generate a bullish breakout in 2017. However, the rally attempt fizzled out.
Based on the current chart formation, it appears rather unlikely UUP will penetrate its 2008 high any time in the near future. Instead, the most likely scenario is a trading range for the next several months, with a slight bias to the downside.

