

PowerShares QQQ ETF (QQQ)
Key Statistics
Daily Short-Term Trend Bullish
Thank you for reading this post, don't forget to subscribe!Intermediate-Term Trend Bullish
Long-Term Trend Bullish
Minor Support Level 149.20 Minor Resistance Level 160.79
Major Support Level 41.55 Major Resistance Level 174.50
Minor Buy Signal 161.94 Minor Sell Signal 147.71
Major Buy Signal 175.66 Major Sell Signal 38.46
BRIEF OVERVIEW – POWERSHARES QQQ ETF
Wall Street is enjoying one of its greatest bull markets of all-time. In fact, this is the 2nd longest uninterrupted bull market in the history of the New York Stock Exchange. The current bull market began on March 9, 2009. January 9, 2018, will mark the 106th month of rising stock prices without a 20% correction. For the record, the longest bull market lasted 113 months, from October 1990 through March 2000.
How much longer can this massive bull market continue? Are we on the verge of a stock market crash? Of course, it’s impossible to accurately answer these questions. However, we can form an educated guess by examining historical data.
Wall Street analysts love to measure the stock market based on various price metrics, performance metrics and valuation metrics. They compare the current levels of today against levels from previous years in order to determine if the market is overvalued or undervalued. In an effort to evaluate the current level of the stock market, let’s review a few of the more popular metrics.
Important Stock Market Valuation Metrics
Metric Current Level Average Level Median Level
Shiller P/E Ratio 32.88 16.81 16.15
S&P 500 P/E Ratio 25.57 15.68 14.68
S&P 500 Price/Sales Ratio 2.27 1.47 1.44
S&P 500 Sales 1185.81 954.97 981.21
S&P 500 Sales Growth Rate 4.83 3.06 3.76
S&P 500 Price/Book Value 3.39 2.76 2.75
S&P 500 Book Value 798.64 528.18 514.60
S&P 500 Earnings Yield 3.91 7.38 6.81
S&P 500 Earnings Per Share 104.75 29.22 20.12
S&P 500 Earnings Growth Rate 19.67 24.85 10.98
Based on historical averages, there’s no question the stock market is overvalued and probably overextended. For example, the Shiller P/E ratio is currently 100% above its historical average. This valuation model was developed by Dr Robert Shiller in the early 1980s. The Shiller P/E ratio is the most popular measuring statistic among financial analysts.
Two other metrics which show the stock market to be overvalued are the S&P 500 Price/Sales ratio and the S&P 500 earnings yield. Both of these measurements are well above/below their historical ranges. Of course, there is no rule which says the stock market must crash simply because it’s overvalued based on a few measurements. In fact, many valuation metrics have been displaying extreme readings for the past 12 to 15 months, yet stocks continue to grind their way higher. At least for now, the stock market is completely ignoring these historical warning signs.
The PowerShares family of exchange-traded funds introduced the PowerShares QQQ ETF on March 10, 1999, using the ticker symbol QQQ. This ETF tracks the NASDAQ 100 Index, which includes 100 of the largest domestic and international nonfinancial companies listed on the NASDAQ exchange. The stocks are selected based on market capitalization. The top five stocks include Apple, Microsoft, Amazon, Facebook and Alphabet. QQQ is one of the most heavily traded ETFs within the universe of exchange-traded funds. The average daily volume is 31.1 million shares.
QQQ is a great ETF to analyze in order to determine the overall health of the stock market because it represents the most popular companies within the investment community. Most likely, QQQ will be the first stock index ETF to begin to unravel when the overall stock market turns bearish. Why? Because it has been the leader on the way up, easily outperforming the S&P 500 ETF (SPY) by almost 14% during the past 52 weeks. Usually, the ETF leaders on the way up are also the leaders on the way down. Therefore, traders and investors should pay close attention to QQQ as an early warning sign of stock market weakness.
SHORT-TERM VIEW – POWERSHARES QQQ ETF
The bulls are in complete control of QQQ on a short-term basis. At least for now, there appears to be no signs of trouble on the horizon for QQQ, despite the extreme valuation metrics discussed previously. QQQ recorded a new all-time high on January 4th @ 160.79. The bears need a weekly close below 149.20 in order to turn the momentum in their favor.
LONG-TERM VIEW – POWERSHARES QQQ ETF
Based on the valuations discussed previously, it certainly appears the stock market is at least slightly overbought and overvalued. In fact, a strong argument could be made that today’s equity market is the most overextended in the history of the New York Stock Exchange. However, that hasn’t prevented the stock market from relentlessly grinding its way higher for the past nine years.
Why are traders and investors basically ignoring the warning signs of an overvalued stock market? Is it possible that these valuation measurements no longer work? Could we be in a new era of investing where the “old school” indicators have become outdated and unreliable?
A strong argument could be made that the stock market has changed to such a degree that equity prices are operating on a new plateau. Of course, we must be very careful to claim that, “Things are different this time.” These are precisely the same arguments that were made near the end of the 1920s and also in the late 1990s, as the dotcom bubble was about to implode.
Nevertheless, there are a few major differences today in the stock market that we’ve never seen before.
Without question, one of the major driving forces pushing stock prices higher is the participation of central banks. For the past few years, major central banks and monetary authorities have been aggressively buying stocks for their own account. For example, the Swiss National Bank has a US stock portfolio valued at $88 billion. It is one of the largest shareholders of US stocks on record. Apple represents its greatest position @ $3 billion. The Japanese monetary authorities also own a tremendous chunk of the US stock market. These
activities by the central banks are unprecedented. This has never happened in the history of central banking. This could be one of the main reasons why the stock market continues to move higher despite the warning signs of a frothy market.
In addition to central bank activity, domestic corporations have been buying back their own shares at a record pace. As corporations buy back their stocks, this reduces the “float,” or the number of shares outstanding. A reduction in supply pushes the price higher.
Another contributing factor to elevated stock valuations is the fact that interest rates are lingering near their lowest level in several decades. Many investors would rather speculate in the stock market in lieu of receiving a low interest rate on a government bond.
These are a few of the main reasons why the stock market has reached rather elevated valuation levels without any type of meaningful correction during the past several years. This trend could easily continue for the next several months.
Certainly, the long-term view of QQQ is extremely bullish. The next level of resistance is 174.50. It would take a substantial decline for the bears to gain control of the long-term trend. The important number for the bears is 41.55.
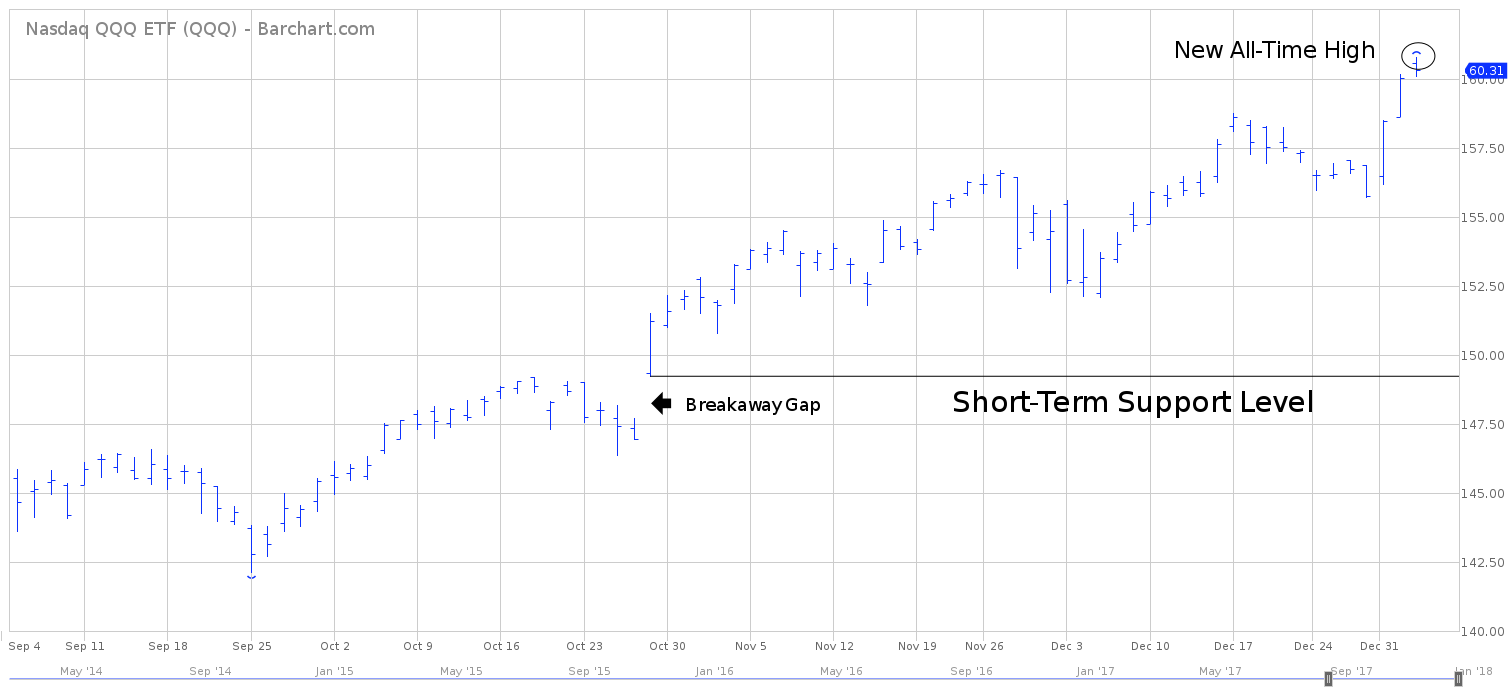
SHORT-TERM CHART – QQQ
Please review the attached 4-month chart of QQQ. The ETF recorded a new all-time high on January 4th. It doesn’t get more bullish than a new historic closing high. QQQ generated a powerful breakaway gap on October 27th. A weekly close below 149.20 will turn the short-term trend bearish.
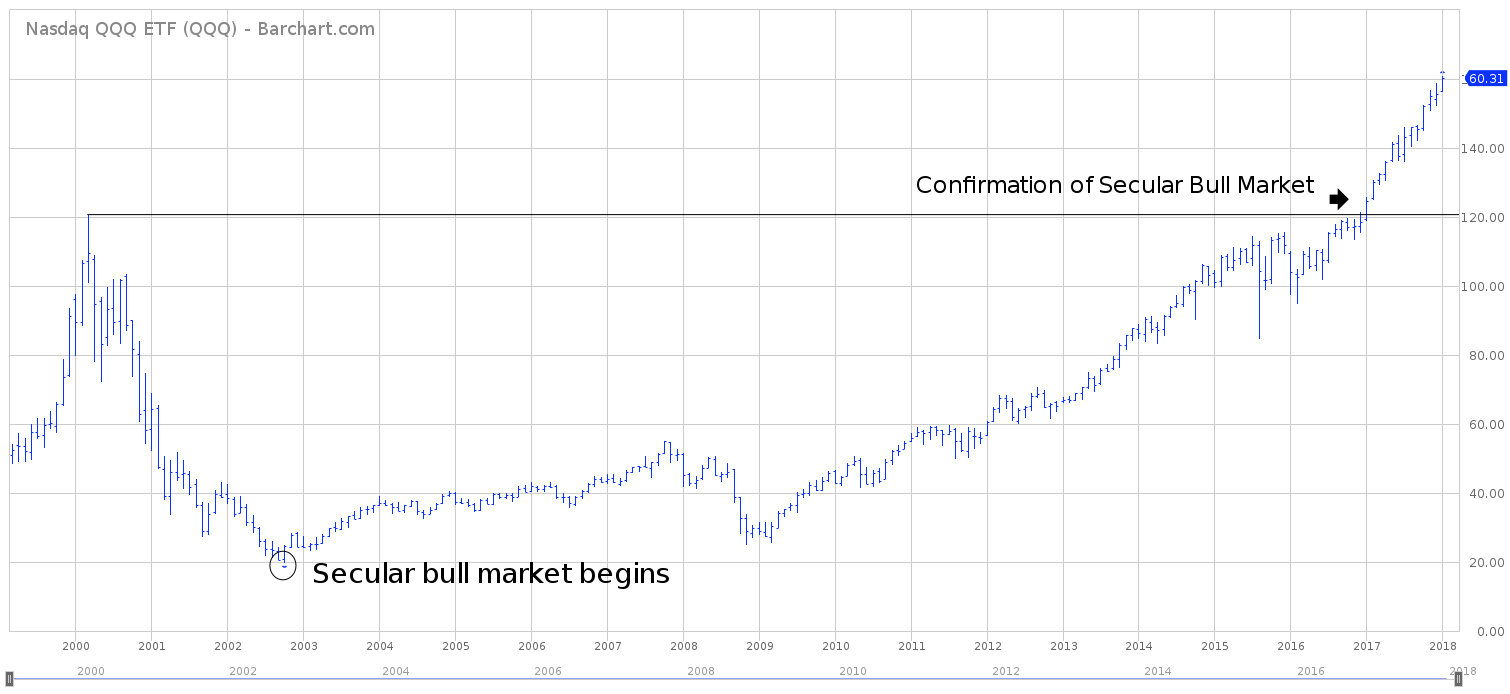
LONG-TERM CHART – QQQ
Please review the attached 18-year chart of QQQ. This chart displays the entire trading history of the ETF. It certainly appears that a new secular bull market began in October 2002. A confirmation of the secular bull market occurred in December 2016, when QQQ penetrated its old high of 120.50. Typically, a secular trend will last 20 to 30 years. Therefore, the current bull market should easily continue into 2022. In fact, an argument could be made that QQQ won’t reach its final peak until the early 2030s.

