

iShares MSCI Japan ETF EWJ
Key Statistics
Daily Close 58.28 Long-Term Trend (100 SMA) Bearish
Thank you for reading this post, don't forget to subscribe!Minor Support Level 57.58 Minor Resistance Level 61.72
Major Support Level 27.36 Major Resistance Level 66.25
Minor Buy Signal 62.33 Minor Sell Signal 57.15
Major Buy Signal 69.82 Major Sell Signal 24.76
BRIEF OVERVIEW – Japan ETF EWJ
In terms of economic destruction, the financial crisis of 2008 will go down in the record books as the most devastating economic event since the Great Depression of the 1930s. The 2008 financial crisis was so disruptive because it impacted the entire global economy. All major industrialized economies were caught in the crosshairs. However, some countries were less affected than others.
In regard to economic contraction, Japan suffered much less damage than other G20 nations following the great financial crisis. Many people forget that Japan suffered its own financial crisis beginning in the early 1990s. This explains why the country escaped relatively unscathed from the events of 2008. Japan was still recovering from the 1990s crisis.
Throughout the 1980s, Japan enjoyed an incredible surge of economic activity. In fact, many economists and financial experts labeled Japan as the “new engine of economic growth.” Japan became the envy of all industrialized economies. Unfortunately, the vast majority of the country’s growth spurt was based on massive real estate speculation fueled by cheap money and low quality bank loans.
The real estate bubble eventually burst and the Japanese economy fell into a pit of despair for the better part of two decades. Even today, 28 years after the country’s financial collapse, there are certain parts of the economy that are still trying to repair the damage. It’s been a long road to recovery for Japan.
In an effort to provide investors with exposure to the Japanese economy, the iShares family of exchange traded funds launched the MSCI Japan ETF on March 12, 1996. The ticker symbol is EWJ. The ETF provides investors with exposure to the largest publicly traded companies in Japan. EWJ has a total of 321 different holdings. The top five companies include Toyota Motor, Mitsubishi UFJ Financial Group, Softbank Group, Sony Corporation and Honda Motor.
SHORT-TERM VIEW – Japan ETF EWJ
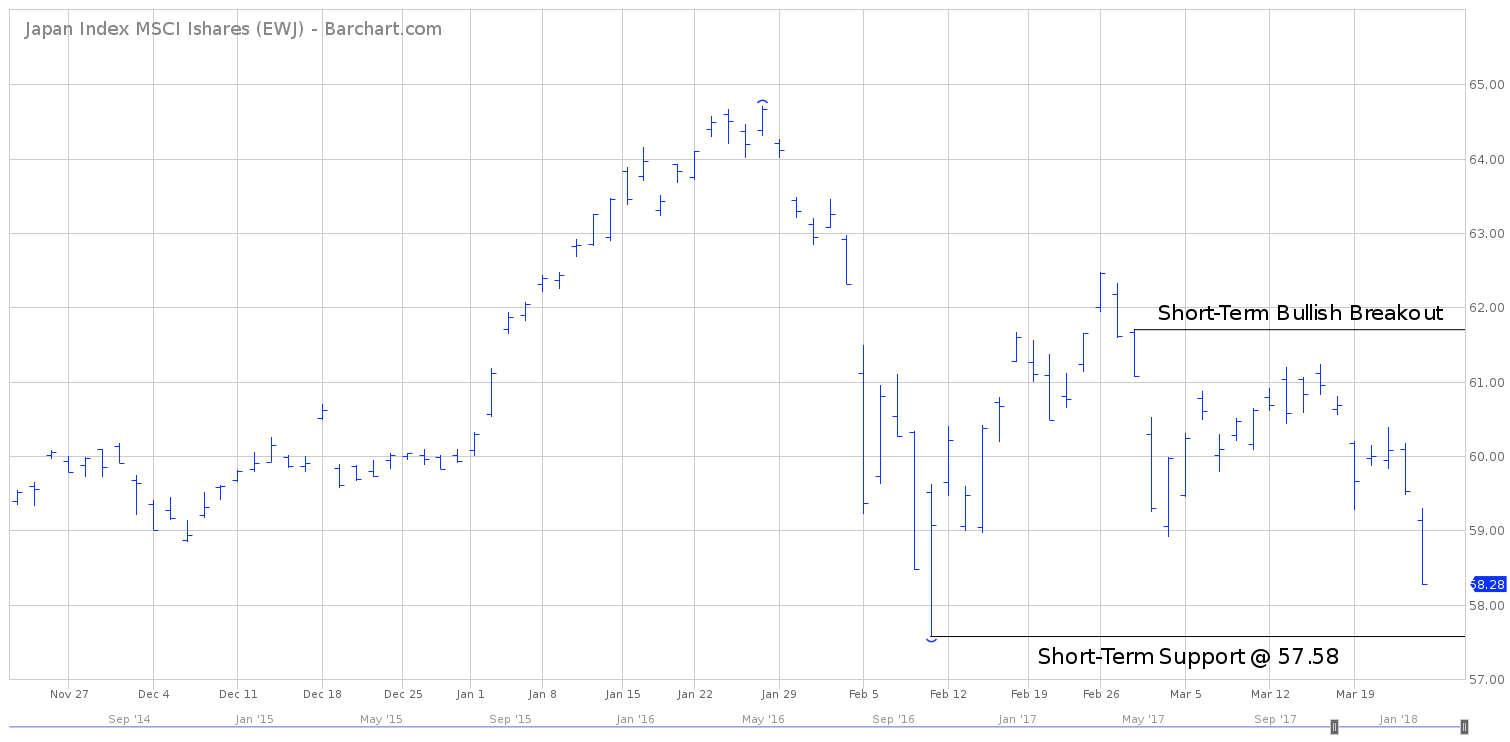
The vast majority of ETFs have been negatively impacted by the recent decline in the overall stock market. EWJ has been no exception. Prior to the brutal stock market sell-off, the bulls were in complete control of EWJ. However, the bears have captured the short-term momentum during the past few weeks. The next level of support is 57.58.
In order to recapture the momentum, the bulls need a weekly close above 61.72. The most likely scenario is a continuation of lower prices. It’s always difficult to reverse the momentum. At least for now, the bears are in complete control of EWJ on a short-term basis.
LONG-TERM VIEW – Japan ETF EWJ
Many financial historians claim that the US Federal Reserve was the first central bank to experiment with quantitative easing. This is not true. That honor goes to the Japanese central bank, known as the Bank of Japan (BOJ).
Following the country’s real estate debacle in the early 1990s, the Bank of Japan embarked on a massive money printing program designed to revive the Japanese commercial banking system. The banks were in dire straits as a result of their relaxed lending practices throughout the 1980s.
The BOJ flooded the banking system with an unprecedented amount of liquidity. The objective was to recapitalize the banks in order to allow them to make new loans, thus reviving the fragile Japanese economy. Unfortunately, the plan was a complete disaster. Why? Because the commercial banks were in such poor shape (from a balance sheet perspective) that they needed all of the BOJ funds just to cover the bad loans on their books. To make matters worse, the majority of the Japanese consumers were dealing with their own set of financial problems, thanks to a massive decline in the stock market and plummeting real estate prices.
For the next ten years (1991 thru 2001), the Japanese economy was essentially frozen, as the BOJ tried unsuccessfully to regenerate the commercial banking system. During this time period, several of the large money center banks in Japan became known as “zombie banks.” For all practical purposes, these banks were insolvent. They were being kept alive by infusions of capital from the BOJ. The Japanese government was determined to support its beleaguered banks until they returned to profitability. Of course, this only made the problem worse.
As the 1990s drew to a close, Japan’s stagnant economy became known as the “lost decade” among those in the financial media. For ten years, the economy was simply unable to produce any type of sustainable growth. Officially, the economy grew at an anemic rate of 0.5% throughout the 1990s. This was by far the lowest rate of economic growth among all G20 nations.
As Japan entered a new decade in 2000, the country was still struggling to recapture its vibrant level of economic activity from the 1980s. Unfortunately, many of the zombie banks from the 1990s were still acting as a drag on the overall economy. Japan limped its way through the 2000s, showing very little improvement from the 1990s. In fact, at end of the decade in 2009, the country’s economic growth rate was exactly the same as the previous decade, at 0.5%.
In 2012, the Japanese economy finally began to show signs of economic strength and stability. The majority of the credit goes to Shinzo Abe, who became the 57th Prime Minister of Japan on December 26, 2012. Immediately following Abe’s political victory, he unleashed an aggressive economic reform program to resurrect the Japanese economy. Specifically, Abe’s new policy concentrated on monetary easing, fiscal stimulus and structural reform. His economic program became known as “Abenomics.”
During the first two years of Abe’s economic program, the country struggled to gain much traction. However, by 2014, Abenomics began to lift the Japanese economy out of its malaise. Currently, the economy is on pace to produce three consecutive years of growth for the first time since the late 1980s.
In addition to Abe’s successful economic program, the zombie banks were finally laid to rest a few years ago. The banks were merged together with some of the healthier financial institutions in Japan. The elimination of the zombie banks turned out to be a huge benefit to Japan’s economy because it allowed the BOJ to concentrate on more productive issues in terms of monetary policy.
Under Abe’s leadership, the Japanese stock market has enjoyed a dramatic rally. The Nikkei 225, Japan’s most liquid stock index, has increased 92.4% since Abenomics was unveiled in 2013. In addition to a rising stock market, Abe has also been successful in turning around Japan’s depressed real estate market. During the past 24 months, the majority of the country’s real estate sector has finally returned to valuation levels not seen since the bubble burst in the early 1990s.
In terms of long-term economic cycles, it certainly appears that Japan is in the early phases of a new period of expansion. Over the course of the next 20 years, Japan could easily become one of the leading economic powerhouses among all G20 nations.
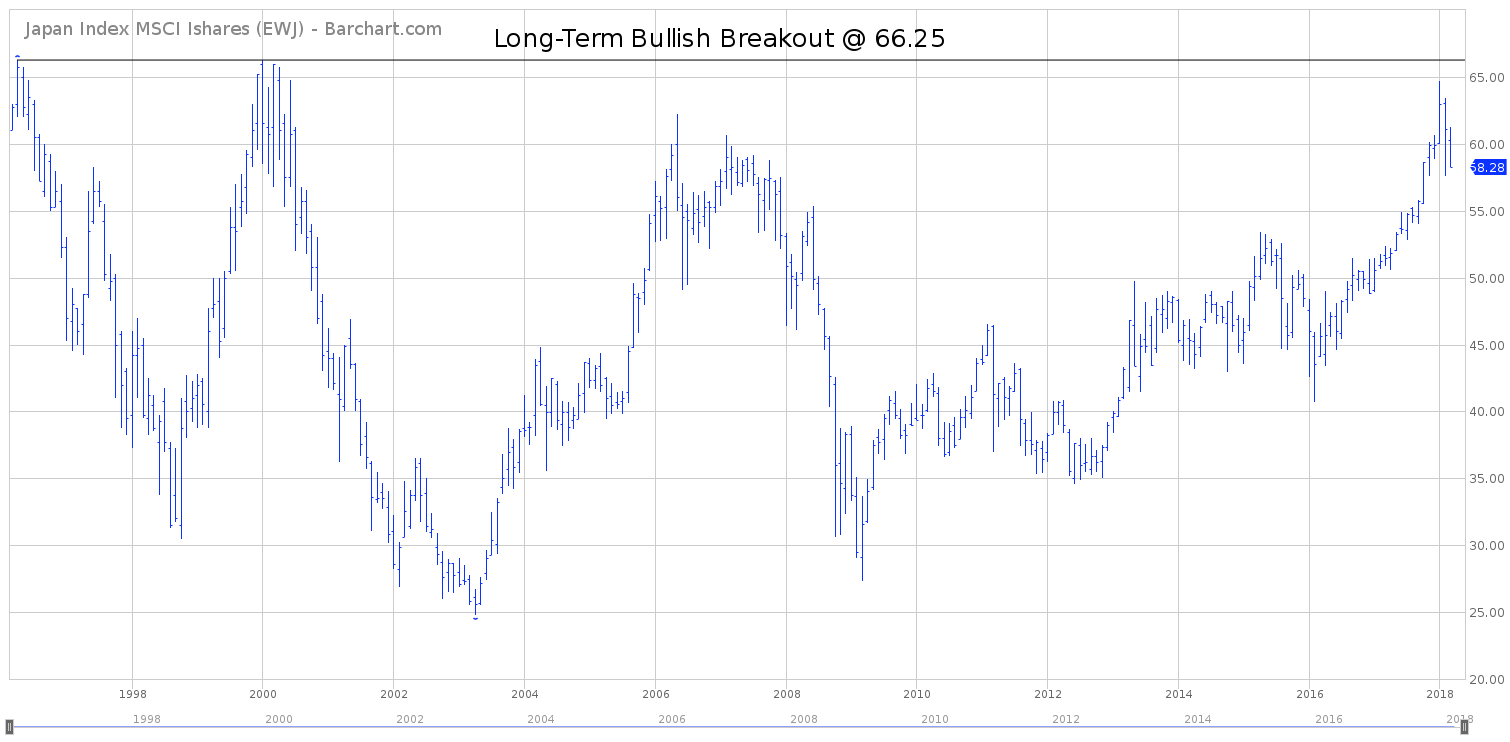
EWJ has produced a tremendous rally during the past several years. Specifically, the ETF has been pushing its way higher since March 2009. Despite the impressive advance, the long-term view of EWJ remains bearish. However, the bulls are fairly close to capturing the upside momentum. A weekly close above 66.25 will flip the momentum from bearish to bullish.
SHORT-TERM CHART – Japan ETF EWJ
Please review the 4-month chart of EWJ. The recent decline in the stock market has created some technical damage to the short-term trend. The current chart pattern is certainly in favor of the bears. The next level of support is 57.58. Based on the current reading of the technical indicators, EWJ could experience a violent short-term decline if the bears are able to generate a weekly close below 57.58.
LONG-TERM CHART – Japan ETF EWJ
Please review the 22-year chart of EWJ. This chart covers the entire trading history of EWJ, dating back to March 1996. Despite the multi-year rally, the ETF remains in bearish territory on a long-term basis. In January, EWJ came very close to achieving a bullish breakout @ 66.25. However, the bears were able to successfully defend their territory by keeping the price below its critical breakout level.
The most likely scenario is an eventual penetration of 66.25. However, due to the recent weakness in the broad stock market, it could easily take several months for EWJ to exceed 66.25.

