

iShares EZU MSCI Eurozone ETF
Key Statistics ISHARES EZU
Minor Support Level 42.39 Minor Resistance Level 47.78
Thank you for reading this post, don't forget to subscribe!Major Support Level 20.08 Major Resistance Level 58.55
Minor Buy Signal 48.65 Minor Sell Signal 41.48
Major Buy Signal 63.69 Major Sell Signal 17.98
BRIEF OVERVIEW – iShares EZU
During the past five years, there has been an endless stream of financial analysts and investment professionals who have forecasted the demise of the Eurozone. The drum beat grew even louder following the Brexit vote on June 23, 2016. The Eurozone has been “left for dead” dozens of times. However, it continues to survive. In fact, based on recent economic data, the Eurozone has been gaining momentum during the past 12 to 15 months. It’s currently operating near its healthiest level in several years.
What exactly is the Eurozone and why is it so important? More importantly, why should investors pay attention? Let’s conduct a brief overview of the Eurozone and place it in the proper context in terms of the global investment landscape.
The Eurozone is a monetary union consisting of 19 European Union (EU) member states. It came into existence on January 1, 1999, with the official launch of the Euro. Each member state has adopted the Euro as its currency. The monetary authority of the Eurozone is the Eurosystem, which is essentially controlled by the European Central Bank (ECB). Please review the following table.
Members of the Eurozone
Member Population Gross National Income % Gross National Income
Austria 8,712,137 423,906 (USD millions) 3.18%
Belgium 11,358,379 530,558 (USD millions) 4.18%
Cyprus 1,170,125 22,519 (USD millions) 0.18%
Estonia 1,312,442 24,994 (USD millions) 0.20%
Finland 5,503,132 264,554 (USD millions) 2.08%
France 64,720,690 2,844,284 (USD millions) 22.39%
Germany 81,914,672 3,853,623 (USD millions) 30.34%
Greece 11,183,716 259,095 (USD millions) 1.97%
Ireland 4,726,078 214,711 (USD millions) 1.69%
Italy 59,429,938 2,147,247 (USD millions) 16.91%
Latvia 1,970,530 30,413 (USD millions) 0.24%
Lithuania 2,908,429 45,185 (USD millions) 0.36%
Luxembourg 575,747 42,256 (USD millions) 0.33%
Malta 429,362 8,889 (USD millions) 0.07%
Netherlands 16,987,330 874,590 (USD millions) 6.89%
Portugal 10,371,627 222,126 (USD millions) 1.75%
Slovakia 5,444,218 96,200 (USD millions) 0.76%
Slovenia 2,077,862 48,625 (USD millions) 0.38%
Spain 46,347,576 1,366,027 (USD millions) 10.75%
As you can see from the table, Germany, France and Italy (highlighted in red) are easily the largest members of the Eurozone in terms of population and gross national income (GNI). They are the “big three” of the Eurozone, responsible for 70% of all economic output.
Despite its economic missteps of the past few years, the Eurozone ranks second globally regarding total economic activity. In 2016 (the most recent year of available data), the Eurozone produced $19.2 trillion in goods and services. China leads all countries, with $21.3 trillion in economic output. The United States is third @ $18.6 trillion. For those who are interested, India ranks fourth @ $8.7 trillion and Japan is fifth @ $4.9 trillion.
This explains why the Eurozone is often called, “the United States of Europe.” This monetary union has turned into an economic juggernaut in less than 20 years. Given its powerful economic standing on the global stage, investors certainly need to pay attention to the future direction of the Eurozone.
In an effort to expose investors to the European economy, BlackRock introduced a Eurozone ETF through its iShares family of exchange traded funds. Using the ticker symbol EZU, the ETF began trading on July 25, 2000. EZU gives investors exposure to the economic activity of the top Eurozone member states. Specifically, the ETF is invested in ten countries within the Eurozone. The top five countries are France, Germany, Netherlands, Spain and Italy.
SHORT-TERM VIEW – iShares EZU
The bulls are definitely in control of the short-term momentum. iShares EZU has generated a very impressive rally over the course of the past several months. In fact, iShares EZU moved continuously higher throughout the entire year of 2017. The ETF is trading at its highest level since August 2008.
The next short-term resistance level is 47.78. In order to reverse the bullish momentum, the bears need a weekly close below 42.39.
LONG-TERM VIEW – iShares EZU
As we discussed briefly, the Eurozone has certainly seen its share of economic distress during the past decade. Trouble started brewing following the global financial crisis of 2008. For the most part, the 19 countries within the Eurozone managed to escape the financial crisis without too much economic damage. However, not all countries were quite so lucky.
The first country to unravel was Greece. The country’s economic hardships began to surface near the end of 2009. Without going into great detail, the Greek government had amassed a huge budget deficit over the course of the previous ten years (1999 – 2009). The government was able to finance the deficit with inflows of foreign capital. However, the inflow of capital dried up following the 2008 global financial crisis. Consequently, the Greek government was forced to dramatically reduce its spending programs in order to bring the budget deficit under control. The reduction in government spending caused the entire Greek economy to falter rather dramatically.
Ultimately, Greece was forced to accept a financial bailout package from the International Monetary Fund (IMF) and the ECB. However, the damage had already been done. The Greek economy performed quite poorly for several years. Its citizens suffered severe economic hardships. In 2016, for the first time since 2008, the country experienced positive economic growth. The Greek economy is finally regaining its footing.
In addition to Greece, Cyprus experienced its own financial crisis in 2012. The crisis was centered around overleveraged loan portfolios of Cypriot banks. More specifically, these loan portfolios were based on overvalued real estate. As the real estate market began to crumble, two of the largest Cypriot banks were forced to dramatically increase their loan loss reserves.
For all practical purposes, the banks became insolvent.
Very similar to the Greek crisis, the IMF and ECB threw a lifeline to the Cypriot government in the form of a €10 billion emergency loan package. The bailout by the IMF and ECB allowed the Cypriot economy to slowly recover. Economic growth for 2018 is forecasted at 2.5%, the highest level in several years.
The lesson to be learned from the Greek and Cypriot crisis is the fact that it doesn’t take much to push an entire economic behemoth, like the Eurozone into a full blown panic. The vast majority of economic activity is based on consumer confidence. History has taught us that confidence is very fickle. It can be lost quite easily.
Despite the brief setback in Greece and Cyprus, the Eurozone appears to be running on all cylinders. The overall Eurozone economy is operating near its highest level since 2009. The future looks bright.
Even though activity is on the rise, the Eurozone continues to be a “punching bag” for financial analysts and Wall Street economists. Each time a financial reporter prepares a news story with a negative twist, the reporter never fails to mention the struggles of the Eurozone. The Eurozone’s obituary has been written several times during the past decade. However, it always manages to survive each crisis. In fact, it usually grew stronger following its string of economic difficulties.
As a side note, Mario Draghi arguably deserves a tremendous amount of recognition for stabilizing the Eurozone economy during the “dark years” of 2010 – 2015. Draghi is the President of the European Central Bank. He is responsible for developing several “creative” financial stimulus programs designed to restore credibility, confidence and economic growth to the Eurozone. Draghi is a master at using the financial media to his advantage. If the Eurozone continues on its current path of prosperity, much of the credit goes to Mario Draghi.
There is a tug-of-war brewing in regard to the long-term view of iShares EZU. The ETF is trading near the middle of its long-term trading range. During the past 12 months, the momentum has favored the bullish camp. Therefore, the bulls have a slight edge over the bears in terms of the long-term view. The next major resistance level for the bulls is 58.55.
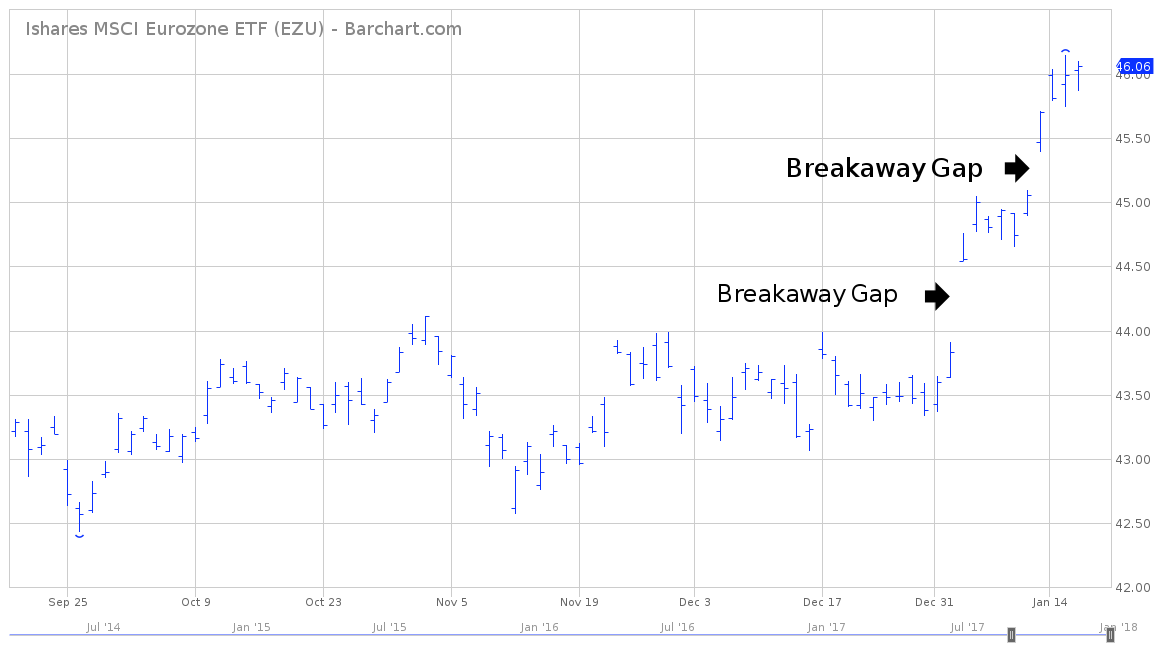
SHORT-TERM CHART – iShares EZU
Please review the attached 4-month chart of iShares EZU. The short-term trend is definitely in favor of the bulls. EZU has enjoyed two bullish breakaway gaps during the past two weeks.
The next short-term resistance level is 47.78. In order to reverse the bullish momentum, the bears need a weekly close below 42.39.
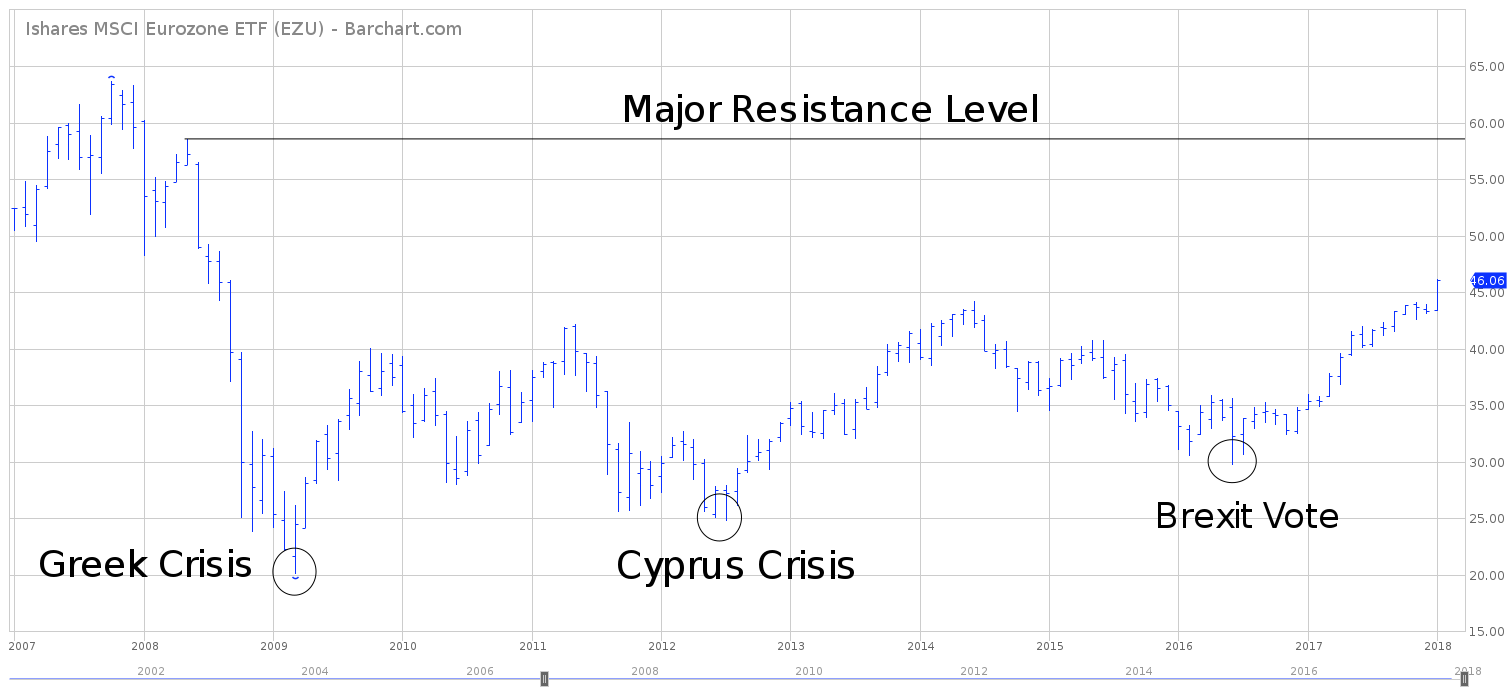
LONG-TERM CHART – iShares EZU
Please review the attached 11-year chart of iShares EZU. The trading range during the past decade has been 20.08 to 63.69. Currently, EZU is locked in the middle of the long-term range. However, the ETF has generated an impressive rally over the course of the past 18 months. Therefore, the most likely scenario is a bullish breakout to the upside @ 58.55.
Regarding the chart pattern, the bulls definitely have the upper hand. iShares EZU has made a series of higher lows and higher highs since 2009. This is a classic definition of a bull market.
Learn more about ETF Timing here.
