iShares S&P GSCI Commodity-Indexed Trust (GSG)
Key Statistics
Thank you for reading this post, don't forget to subscribe!
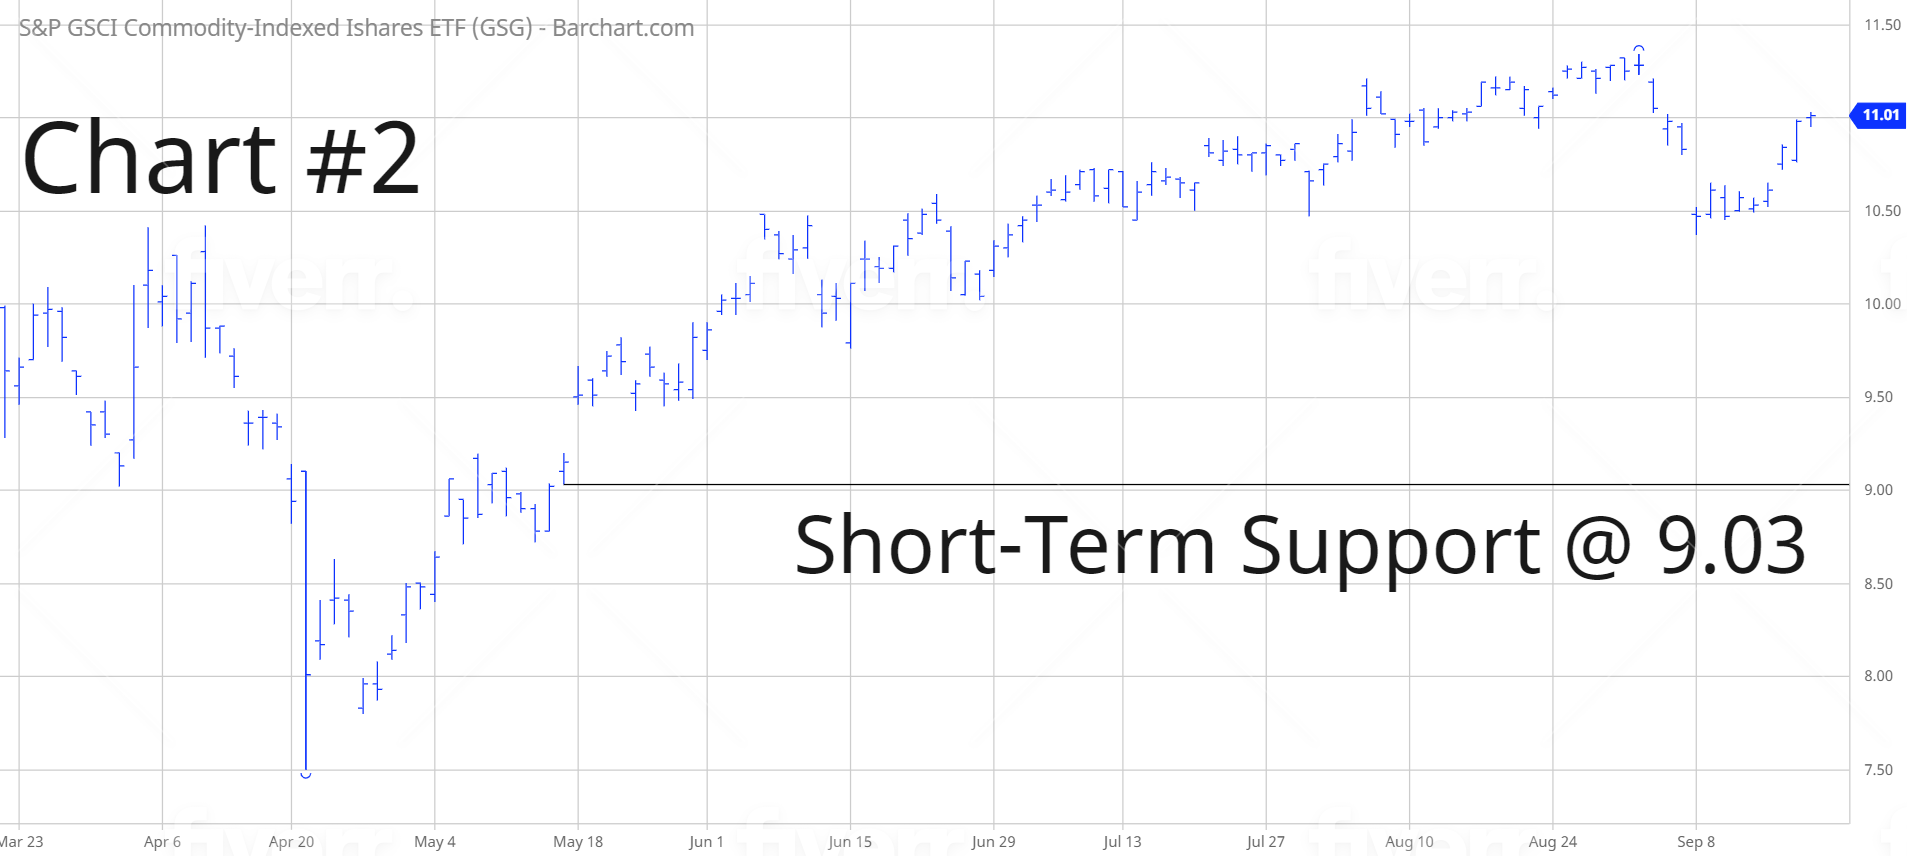
Minor Support Level 9.03 Minor Resistance Level 12.74
Major Support Level 5.70 Major Resistance Level 57.91
Minor Buy Signal 14.59 Minor Sell Signal 7.50
Major Buy Signal 66.35 Major Sell Signal 2.78
Since 1978, the Federal Reserve Bank of Kansas City has hosted an annual monetary policy symposium in Jackson Hole, Wyoming. The annual symposium is attended by the world’s leading monetary authorities, central banks, policy experts, global economists and Wall Street money managers.
The purpose of the 3-day gathering is to allow the titans of finance to discuss the current state of the global economy along with future monetary policy by G20 central bankers. Historically, some of the most important policy decisions have been unveiled at the Jackson Hole event. This explains why the symposium is heavily covered by all of the major financial news organizations around the globe.
In response to the global pandemic, the Kansas City Fed held a virtual meeting on 27 August in lieu of the Jackson Hole meeting. Several G20 monetary leaders presented thoughtful speeches concerning the future direction of economic activity. Arguably, the most important speech of the day was delivered by Federal Reserve Chairman Jerome Powell. During his speech, Powell made a rather shocking announcement. In an effort to stimulate the domestic economy, Powell stated that the Federal Reserve would attempt to push the rate of inflation above the targeted level of 2.0%. This marked the first time in the history of central banking that the Fed was actually trying to exceed its targeted level of inflation.
Why would the Federal Reserve attempt to create inflation? Because Chairman Powell is fully aware that government debt levels will explode during the next few years as a result of aggressive monetary policy in response to the global pandemic. The only logical way to reduce the mountain of debt is through inflation. This is one of the oldest tricks in the book. During the past several decades, other central banks have used this method to reduce government debt levels. However, this marks the first time that the Federal Reserve has used its monetary tools to create inflation. This is a clear message that the Fed and other government leaders are seriously concerned about our nation’s level of debt.
Will the Federal Reserve have a difficult time creating inflation? The answer is, “Yes.” During the past four decades, inflation has been practically non-existent in the United States. Please review the following tables.
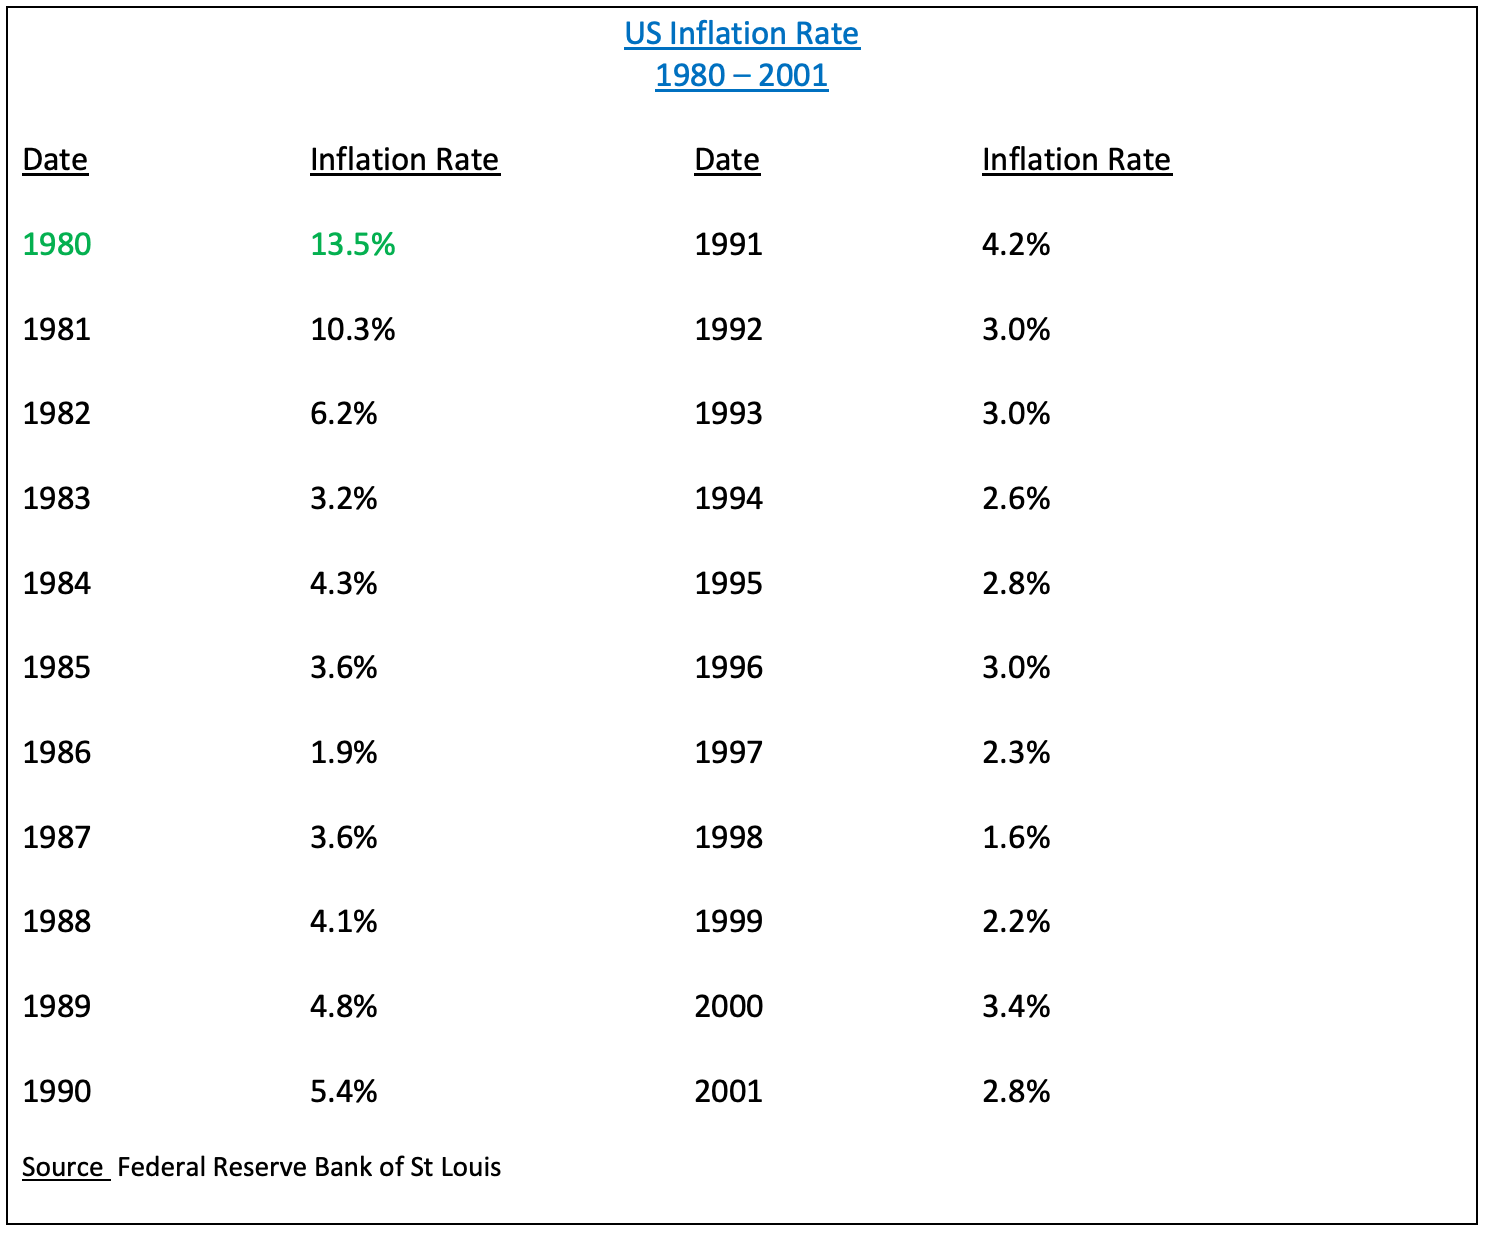
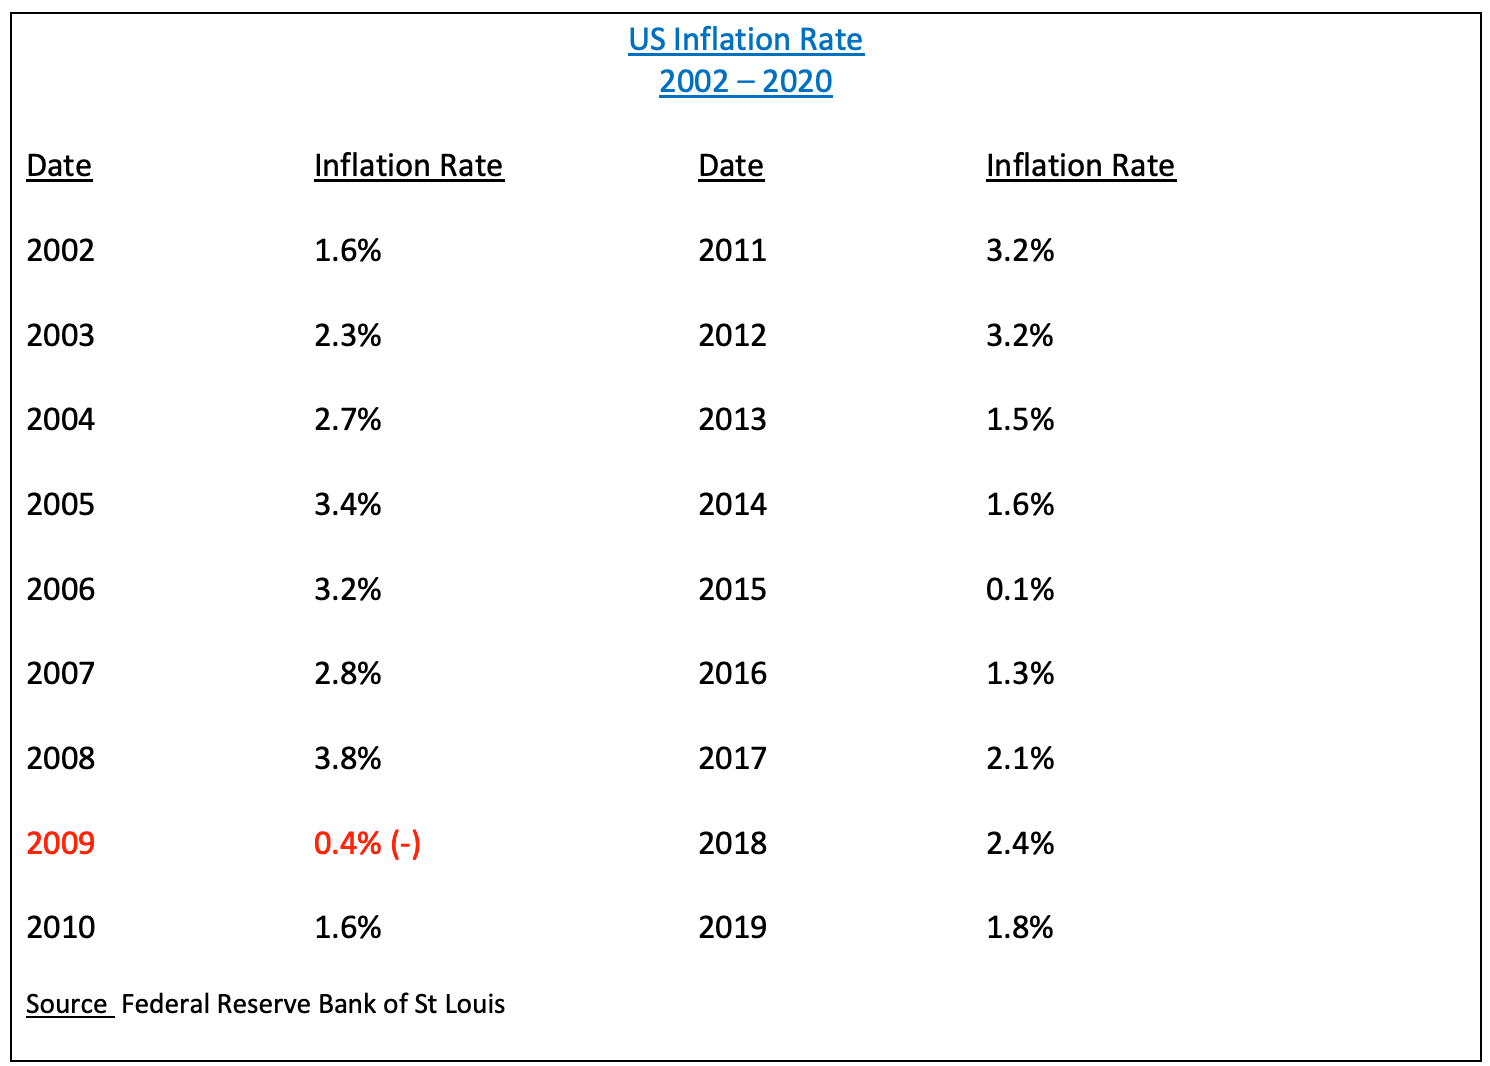
As you can see, the United States has enjoyed benign levels of inflation since 1983. This is particularly true during the past five years. Since 2015, the average annual rate of inflation has been 1.5%. Therefore, the Federal Reserve will be forced to introduce aggressive monetary policy in an effort to kickstart inflation.
How can investors take advantage of the Fed’s attempt to create inflation? Historically, the best performing asset class during rising levels of inflation has been commodities. This was particularly true in the late-1970s and early-1980s. Many commodities increased several hundred percent from 1979 thru 1981. Most likely, the commodity universe will generate another substantial rally over the course of the next five years.
The iShares family of exchange traded funds (managed by BlackRock) introduced the S&P GSCI Commodity-Indexed Trust on July 10, 2006. The ticker symbol is GSG. This investment vehicle is not a standard ETF (as defined by the Investment Company Act of 1940). Instead, GSG is a statutory trust registered with the Commodity Futures Trading Commission as a Commodity Pool. Investors’ assets are “pooled” together in order to purchase exchange-traded index futures contracts. These index futures contracts represent investments in various commodities. Therefore, GSG is a perfect vehicle for investors who are searching for “pure play” exposure to the commodity markets. The top five commodities within GSG include crude oil, natural gas, corn, heating oil and aluminum.
SHORT-TERM VIEW – GSG
Despite the brutal decline following the initial shock of the global pandemic, the bulls have managed to recapture the short-term momentum. GSG has enjoyed a substantial rally during the past 5 months. The next level of resistance is 12.74. In order to reclaim the momentum, the bears need a weekly close below 9.03.
Based on the Aroon Oscillator, GSG has a neutral reading of -16. The Aroon Oscillator is programmed differently than most stochastic indicators. The oscillator fluctuates between -100 and +100. A reading of 0 would indicate a neutral position. Therefore, a reading of -16 is considered fairly neutral. Based on the current level of the oscillator, the next big move could be in either direction. The most likely direction is a breakout to the upside.
LONG-TERM VIEW – GSG
The fact that the Federal Reserve publicly announced its intentions to create inflation is a clear sign of desperation. Probably for the first time in the history of the Federal Reserve, policy makers are seriously concerned about the rising level of debt as well as the Fed’s bloated balance sheet. Our nation’s monetary leaders have no choice but to inflate their way out of this mess. This will be incredibly bullish for commodities. In fact, several commodities have been moving higher during the past few months in response to aggressive monetary policy.
- Crude Oil +538.3%
- Silver +129.8%
- Copper +51.2%
- Cotton +36.8%
- Gold +34.8%
- Palladium +29.4%
- Cattle +27.2%
- Soybeans +20.7%
As you review Chart #1, please remember that commodities follow cyclical trends and secular trends. Typically, a cyclical trend will last 7 to 9 years. A secular trend will last 25 to 30 years. A secular bull market commenced in October 2001. The cyclical bull market ended in April 2011. However, a new cyclical bull market began in April 2020. Therefore, both cycles are pointing in the same direction. The cycles are lining up perfectly with the Fed’s aggressive monetary policy. Consequently, during the next 4 to 6 years, commodities could easily be the best performing asset class.
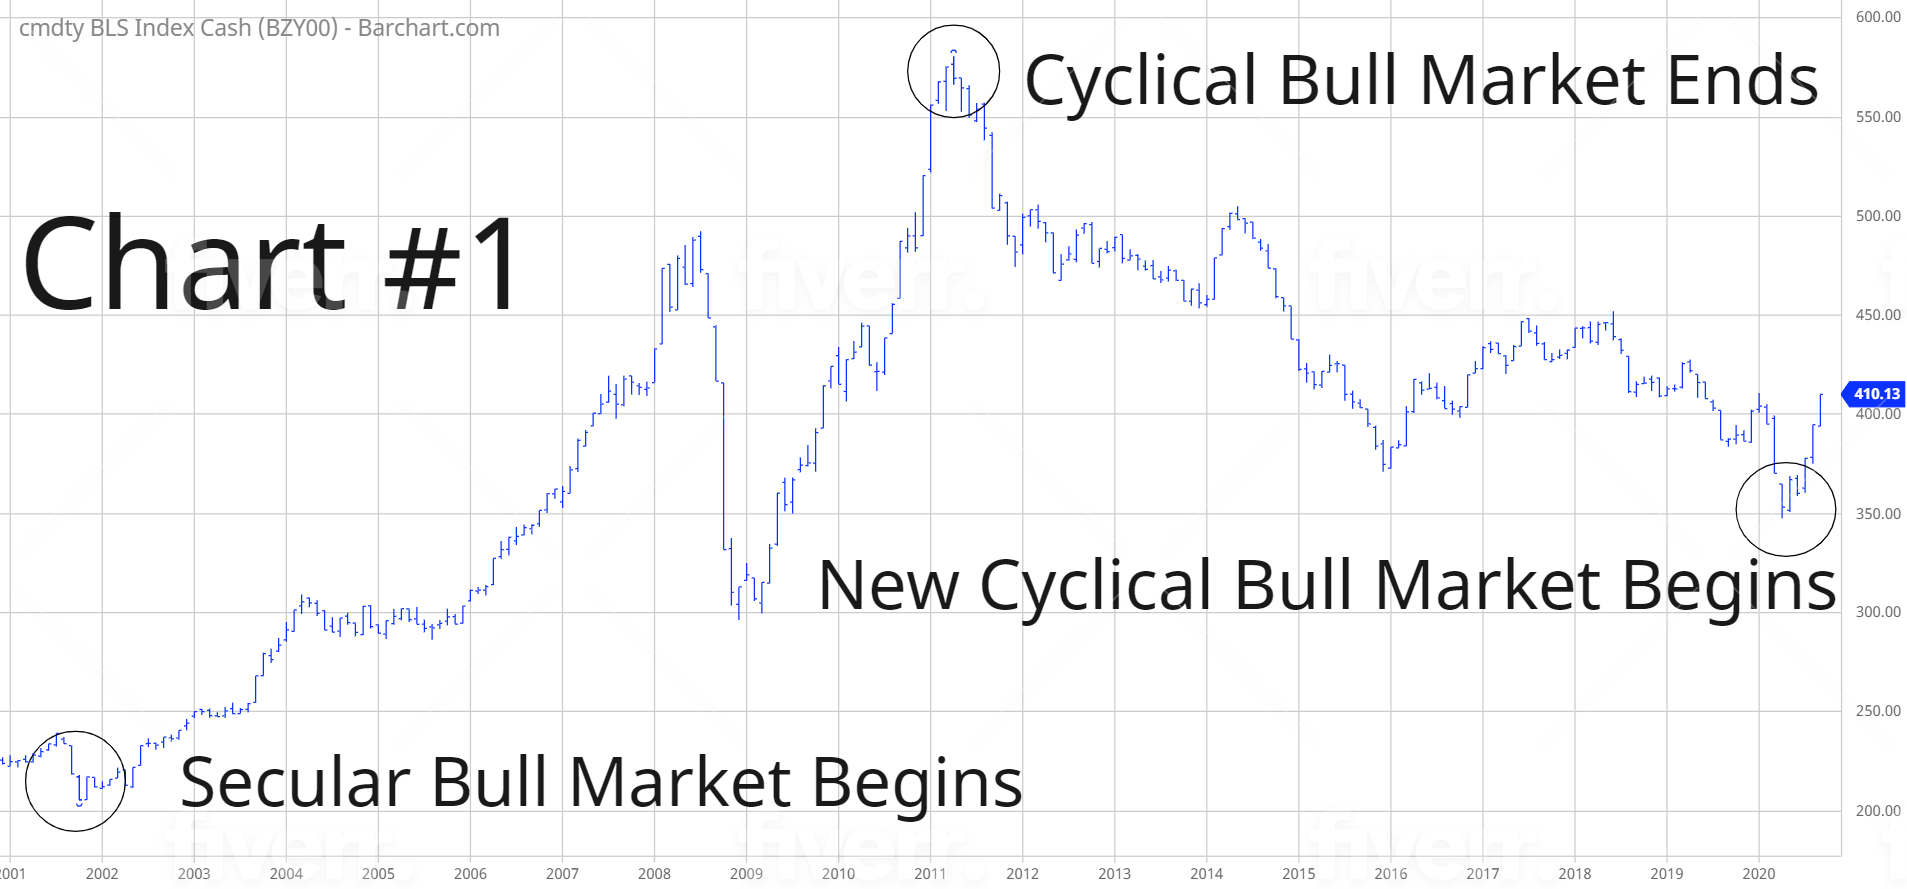
Many analysts believe that the commodity universe entered a new secular bear market in 2011. Most likely, this forecast is wrong. We can all agree that a new secular bull market began in 2001. As we mentioned, secular trends typically last 25 to 30 years. Therefore, the 2001 secular bull market should continue until at least 2025. Of course, it is possible that the secular bull market ended in 2011. However, if this forecast is correct, it would mark one of the shortest secular bull markets in the history of commodities. The most likely scenario is that commodities are still in a multi-year secular bull market.
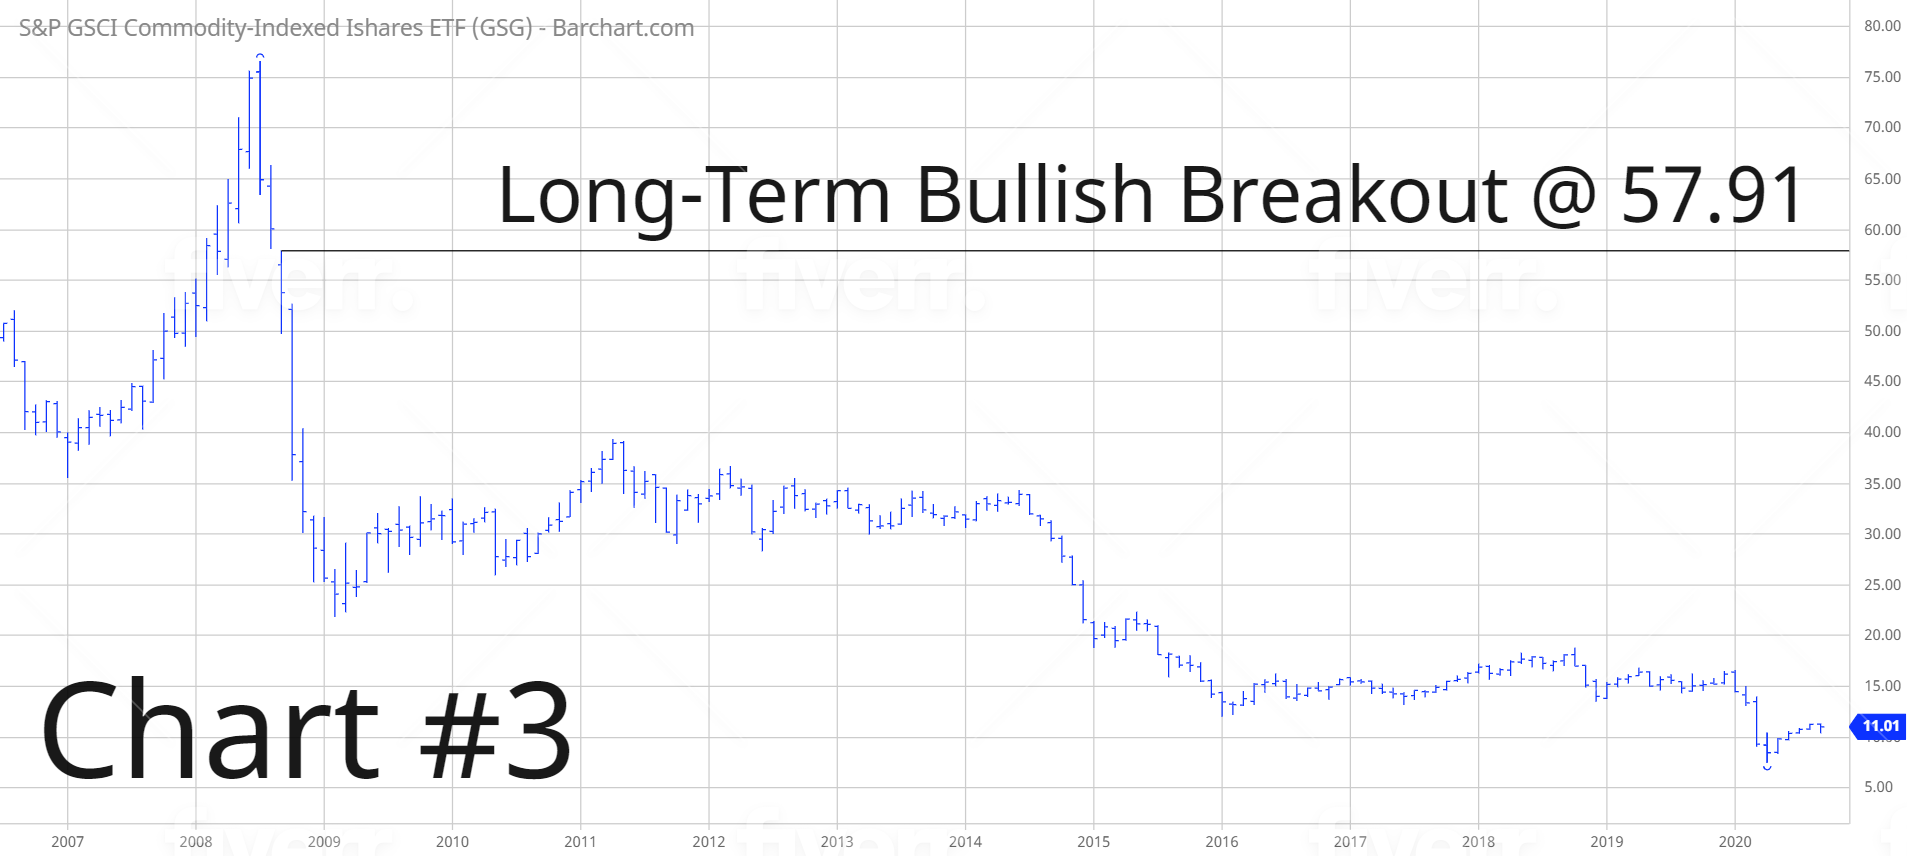
In regard to GSG, the long-term view is heavily in favor of the bears. A weekly close above 57.91 is needed in order to reverse the momentum. GSG is an energy-heavy index. The majority of the index is comprised of energy commodities. For example, 52% of the index consists of crude oil, natural gas and heating oil. This explains why GSG formed a major top in 2008, along with the price of crude oil.
SHORT-TERM TREND
Please review the 6-month chart of GSG (Chart #2). The short-term chart pattern is in favor of the bulls. GSG has generated a substantial rally over the course of the past 5 months. The next level of resistance is 12.74. In order to reclaim the momentum, the bears need a weekly close below 9.03.
LONG-TERM TREND
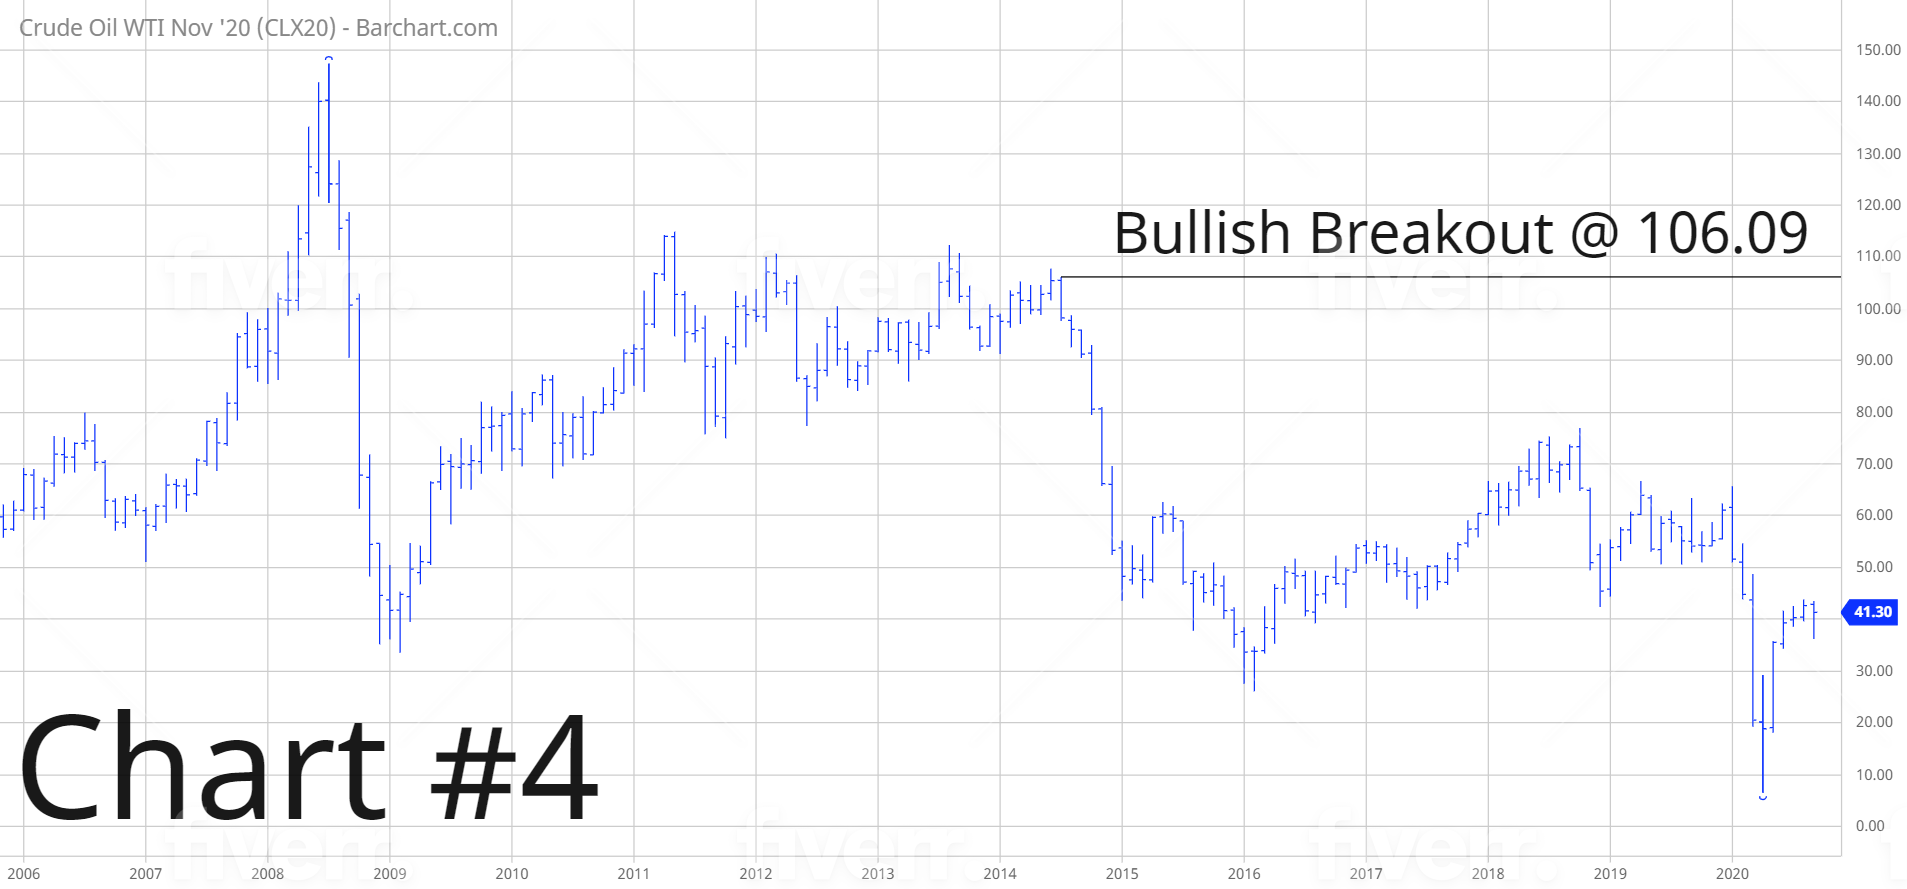
Please review the 14-year chart of GSG (Chart #3). This chart covers the entire trading history of GSG. A weekly close above 57.91 is needed in order to create a bullish chart pattern. The most important market to watch is crude oil (Chart #4). A weekly close above 106.09 in crude oil would be extremely bullish for the long-term trend of GSG.