

The Obesity ETF (SLIM)
Key Statistics
Thank you for reading this post, don't forget to subscribe!
Minor Support Level 30.73 Minor Resistance Level 40.01
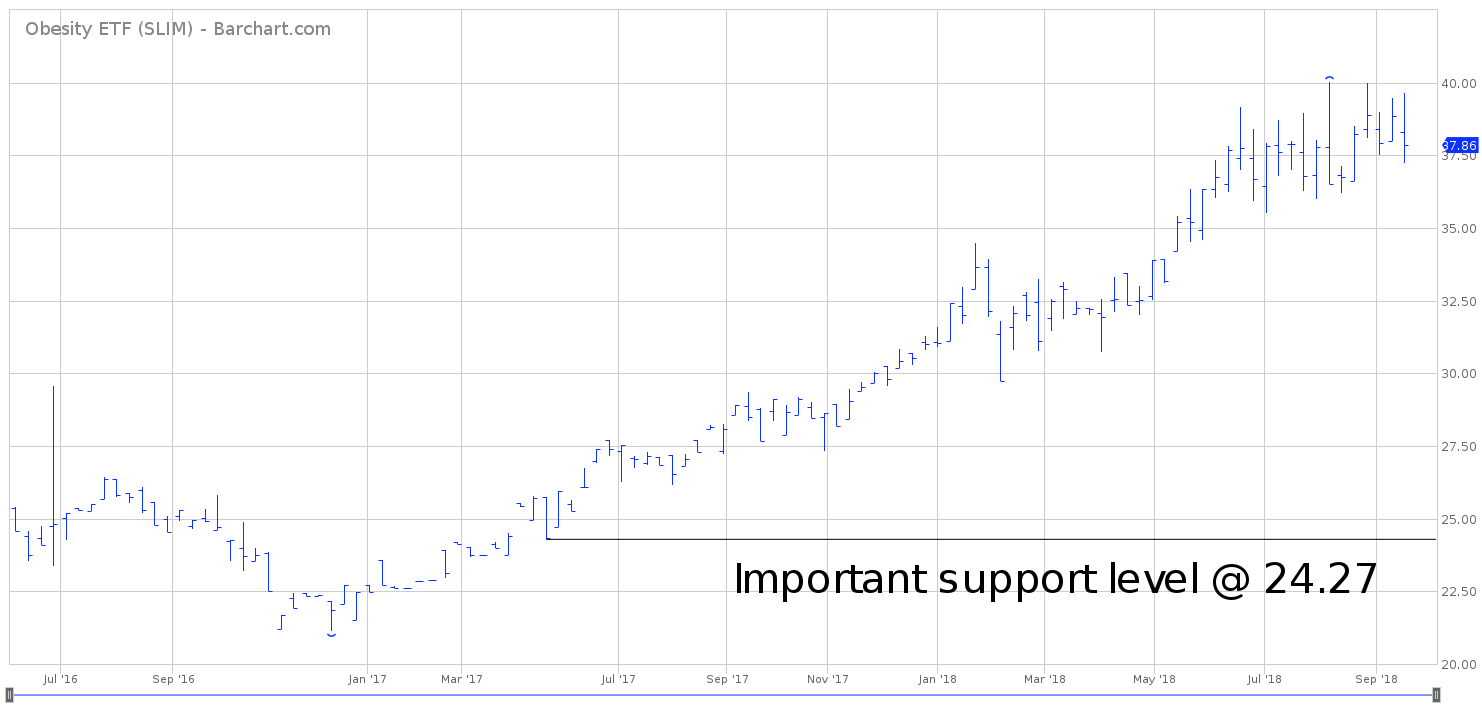
Major Support Level 24.27 Major Resistance Level 40.01
Minor Buy Signal 45.61 Minor Sell Signal 28.59
Major Buy Signal 47.05 Major Sell Signal 21.15
BRIEF OVERVIEW
Have you ever looked at an old magazine, photo album or high school yearbook from the 1940s, 1950s or 1960s? It’s always fun to examine the fashion trends, hair styles, latest consumer gadgets and the overall lifestyle of society. Judging from the photos and various advertisements, it certainly appears that life was much simpler fifty years ago. Of course, that’s probably why today’s senior citizens refer to their teenage years as “the good old days.”
Many things have changed from fifty years ago. One of the more disturbing trends is the dramatic increase in the number of overweight people. In the 1950s and 1960s, a very small percentage of people were overweight. Today, the number of overweight people in the United States is alarmingly high. At least for now, there appears to be no end in sight. Based on a research report released by the OECD in 2017, the obesity rate in the United States is expected to reach 47% by 2030. This is truly a shocking statistic. Basically, half of the people in this country will be obese within 12 years.
Unfortunately, the United States is not the only country dealing with rising levels of obesity. The vast majority of G20 nations are struggling with an overweight society. This includes countries such as Canada, Mexico, Australia, Japan, the UK and Germany. Obesity is even spreading to several developing countries like China, India, Egypt and Pakistan. The World Health Organization (WHO) has officially labeled obesity as a global epidemic. This problem is not going to disappear any time soon.
How did obesity become such a problem in a relatively short period of time? As far as the United States is concerned, the problem can clearly be traced back to the “suburbanization of America.” What is suburbanization? It is the population shift away from rural living and city living into a lifestyle outside of the city limits. This type of lifestyle is known as “living in the suburbs.”
Suburban living in the United States slowly began to increase during the major economic expansion following the end of World War II, as veterans returned home from the war. The popularity of suburban living literally exploded throughout the 1960s and 1970s, thanks to advances in technology, infrastructure and transportation. The idea of living outside of the “hustle and bustle” of the city was very appealing to a large number of American consumers.
Unfortunately, as sociologists and health experts have slowly concluded during the past 20 years, suburban living is not the healthiest of lifestyles. The main problem with suburban living is the amount of time it takes to commute to work on a daily basis. People who reside in the suburbs soon discover that traveling to work consumes a large amount of their daily lives. By its very nature, driving is an unhealthy activity because it has a tendency to be rather stressful and it requires the driver to remain in a sedentary position for an extended period of time.
Several research studies have shown that suburban commuters are less likely to exercise because they simply don’t have the time or the energy to follow an exercise program after returning home from a long day at work in the city. It’s not uncommon for suburban residents to spend 15 hours per week traveling to work. Based on the research reports, this type of lifestyle will eventually cause many people to become overweight. The majority of health experts agree that it could easily take 30 years to educate people on how to live a healthier lifestyle. Therefore, the obesity epidemic in the United States will continue well into the future.
The Janus Henderson family of exchange traded funds introduced the Obesity ETF using the ticker symbol SLIM. The ETF was launched on 8 June 2016. SLIM allows investors to gain exposure to companies who are actively searching for a solution to the global obesity epidemic. The list include biotechnology, pharmaceutical, health care and medical device companies. The ETF also consists of companies focused on weight-loss programs, supplements and plus-sized apparel. SLIM is comprised of 47 different holdings. The majority of the companies within the ETF are headquartered in North America @ 64.8%.
SHORT-TERM VIEW
Despite a small pullback during the past two weeks, the short-term view remains bullish for SLIM. The ETF has been grinding its way higher since January. The next short-term resistance level is the all-time high from 8 Aug @ 40.01. In order to reverse the upside momentum, the bears need a weekly close below 30.73.
LONG-TERM VIEW
As we discussed previously, the rising level of obesity in the United States can be traced back to the 1960s, as suburban living became increasingly popular. In addition to suburban living, there are two other reasons why obesity has become an epidemic in the United States. Let’s review the facts.
As a percentage of GDP, food prices have been drifting lower for the past five decades. Why have food prices remained calm for the past 50 years? There are two main reasons. The first reason is because farmers are incredibly efficient at producing food for the American population. The agriculture industry has generated tremendous economies of scale during the past few decades as more bushels of grain have been produced on a larger scale with fewer input costs. Secondly, North American farmers have enjoyed several years of near perfect growing conditions. As a result, the global supply of grain and food commodities are near an all-time high.
Very briefly, let’s examine the numbers on an individual basis. Based on data provided by the USDA, the average American worker spent 17.5% of her/his annual salary on food in 1960. In 2016, the number had fallen dramatically to 6.4%. This represents a 63.4% reduction in the cost of food for American consumers. This is a huge decline. Basically, it allows consumers to eat more food without incurring an additional cost. This is another factor which explains our nation’s problem with obesity.
In addition to falling food prices, there is one disturbing trend which has slowly crept its way into the lifestyle of most American families. This trend began to gather momentum about the same time that families were moving to the suburbs. Making the switch from city life to the suburbs was certainly an expensive undertaking in the 1960s. In fact, most families were unable to afford suburban living on a single income. As a result, mothers were forced to seek employment in order to afford the new suburban lifestyle. This marked the first time in American history where a large percentage of females entered the workforce.
According to research conducted by health experts and sociologists during the past two decades, they have suggested that much of today’s obesity can be traced back to the breakdown of the American family. Their research claims that children who grew up in households with two working parents experienced a sharp decline in healthy eating habits. More specifically, children would eat more processed food (i.e. TV dinners, frozen food, fast food and ready-to-eat meals). These types of meals replaced the home-cooked meals that the mother would prepare. When the mother of the family was required to enter the workforce, there simply was not enough time to cook a fresh meal on a daily basis. As a result, family eating habits completely changed throughout the 1960s and 1970s. Today, 50 years later, the majority of these unhealthy eating habits still exist within the confines of a typical American family.
From a chronological perspective, it’s certainly no coincidence that America’s obesity problem began to unfold when stay-at-home moms were required to joins the ranks of the working class. This is certainly one of the root causes of American’s poor eating habits. However, there does appear to be a light at the end of the tunnel. Based on several research studies conducted by experts who study the millennial generation, there is a noticeable shift occurring within this specific age group of working families. A sizeable percentage of Millennial families are choosing to stay home with their children. They are content with living a much simpler life in a smaller house in exchange for raising their children on a single income. Researchers claim this type of change within the Millennial generation (if it continues) will eventually reverse the obesity problem in the United States. However, health experts are quick to point out that obesity in the US probably won’t reach its peak until 2030. Basically, it will take an entire generation to solve this problem. Please review the following tables.
US Obesity Rates Among Adults
1997 Through 2007
Date Obesity Rate YOY % Increase
1997 19.4%
1998 20.6% 6.2%
1999 21.5% 4.4%
2000 21.8% 1.4%
2001 23.0% 5.5%
2002 23.9% 3.9%
2003 23.7% 0.8% (-)
2004 24.5% 3.4%
2005 25.4% 3.7%
2006 26.4% 3.9%
2007 26.7% 1.1%
Source Statista
US Obesity Rates Among Adults
2008 Through 2017
Date Obesity Rate YOY % Increase
2008 27.6% 3.4%
2009 28.0% 1.4%
2010 28.4% 1.4%
2011 28.7% 1.0%
2012 28.9% 0.7%
2013 29.0% 0.3%
2014 29.9% 3.1%
2015 30.4% 1.7%
2016 30.6% 0.6%
2017 31.3% 2.3%
Source Statista
As you can see from the tables, obesity rates have steadily increased during the past two decades. Nutrition experts agree that rates of obesity in the United States will continue to climb for the next 12 years. The peak should occur in 2030 near the 47% level. Without question, this problem will persist well into the future. It could easily be 2050 to 2070 before America’s problem with obesity is under control.
In regard to SLIM, it’s rather difficult to discuss the long-term view because the ETF has only been in existence for 26 months. However, based on the limited amount of data, SLIM easily remains in bullish territory. The next level of resistance is 40.01. The ETF will remain bullish as long as it stays above 24.27 on a weekly closing basis.
SHORT-TERM CHART
Please review the 6-month chart of SLIM. The ETF has been trading sideways for the past four months. The trading range is 35.50 to 40.01. Currently, the chart pattern is neutral with a slight bias to the upside. The next resistance level is the all-time high @ 40.01. A weekly close below 30.73 would send the chart pattern into bearish territory.

LONG-TERM CHART
SLIM has a limited trading history of only 27 months. Therefore, it’s difficult to determine the long-term trend based on the current chart pattern. At least for now, the trend is bullish. The ETF will remain bullish as long as it stays above 24.27 on a weekly closing basis.

