blog

ETF Power Score and the Macro Market

Can we predict where the major indices are heading next?

Ready To Fire Your Money Manager?

Free Access to the NetPicks ETF Investor - 100+ Top ETFs Analyzed

Subscribe

One of the elements I enjoy tracking is the number of Exchange Traded Funds that currently have a Positive Power Score. In particular, when compared to the entire list.

It tells you a lot about the strength – or weakness – of the broader markets. Since our ETFs cover all market caps, all major regions, all asset classes and many sectors you get a very broad range view of the health of the global markets.

It would not be a stretch to say that if 10% of the ETFs have a positive Power Score things are quite dire. If 80% are positive – then clearly most markets are rolling in the upside momentum gains.

I thought it would be a productive idea to start to quantify the percentages. Let’s take a look from the start of 2015 until the present here:

Exchange Traded Funds Power Score Ratings

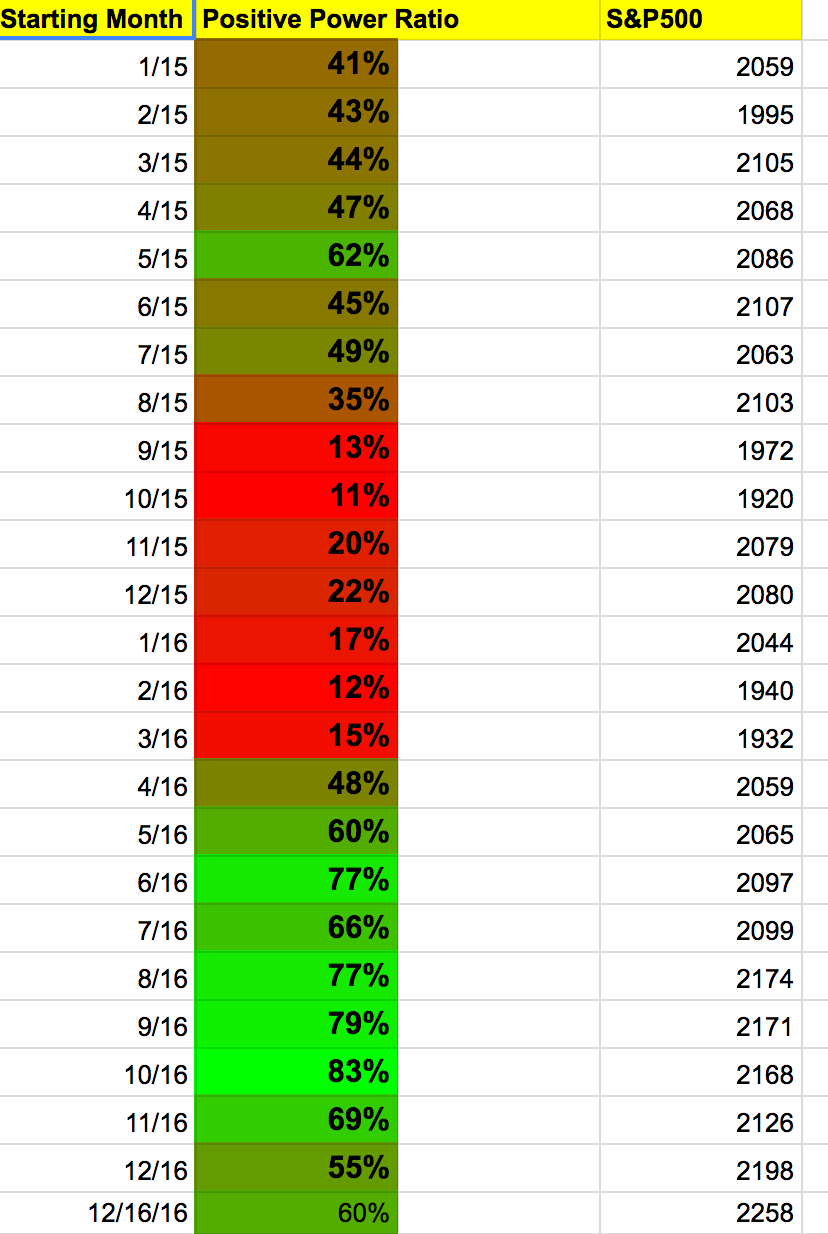
Let’s discuss what you are looking at above. The column with the months shows the current percentage of ETFs we are tracking (150+) at the start of the month that is exhibiting a positive Power Score. Almost always, those are ETFs that are making gains and in an uptrend. You can then see the percentage from none to 100% that are positive at the start of that month.

Lastly, it’s interesting to see where the S&P500 was at the start of that month since you can start to draw some fairly conclusive correlations between the Power Score and the S&P500 (along with other major benchmarks.)

The question is whether this can be predictive? Based on my observation I typically see anything 50% or higher being firmly in buy territory. 40% – 50% is a yellow light for me. There are issues, and we should be watching for a potential correction (assuming it’s on the way down from a higher threshold) and definitely below 40% would indicate losses were happening in your portfolio typically.

I’ve then color ranked from the most solid green being the best months, to the reddest being the weakest. The peak was October 2016. The weakest in this range was exactly one year prior in October 2015.

You can see the predictive nature since it dropped below 40% at the start of August 2015. The start of April 2016 was the first time back above 40 and May 2016 above 50. You can see being sidelined during that full stretch certainly avoided a pretty good sized drawdown.

I’ll update these numbers weekly for you – as well as save it on a monthly basis so we can get some early indicators on a macro level when to expect the next downturn.

Any comments and questions? Feel free to leave those below.

15 Comments
  1. William Villanueva says:

    I really like what you are doing. Very clear and intuitive. Thank you for what you are making available. I look forward to basing my investments on it.

    1. Mark Soberman says:

      Thanks for the nice comments William. Glad you are enjoying and will utilize. Will keep it rolling…

  2. Frank says:

    What a nice and helpful idea! First the list of quality / performance of such a lot of ETFs and now a Check of the Market State based on their Scores. Where will you place this table (URL)?

    I have an idea for further developing:
    Many peoples loves graphs instead or as addon of a list of numbers. You use different colors to visualize the state which is helpful. But what do you think about to add a chart which shows the history of the %-Numbers from week to week in a line? Set the base line of the chart not to zero but to 50 then anybody can identify the trend with one short look. And if you want you could use a double sided diagramm (not sure if this is the right name in English) which is offered in Excel and can let visualzed the S&P also. I could send you an example if you would give me some data (in moment it’s only a picture in this article).

  3. Kenneth Gray says:

    Mark,
    Are you ever concerned about over-bought and then reversion-to-the-mean tendencies may follow? Can things be “too green” to initiate new positions?

    1. Mark Soberman says:

      Kenneth, that’s a good question. I personally like to enter best when I’m getting a buy signal – meaning the crossover and positive of the Power Score and Long Term Trend numbers. The challenge of course is when that already has happened and you are getting in late – meaning that crossover happened previously. For example, in my personal trading I started getting buy signals on April 11, 2016 – that’s the earliest of my holdings through until 8/22/16. And have been long since. So, if you’re new do you chase these given their current levels? It’s not an easy call when first trying to synchronize. Since you are getting in higher than our entries in all cases due to the extended bull the reality is the first wave will have smaller gains. Or, you can sit aside and wait for them to cross-over to ‘sell’ and back to buy. However, that can be difficult to predict if that will happen within weeks, or months.

  4. Claudius Pais says:

    I looked at the ETF chart. I want to know when the trader makes money. Does he have to sell the ETF or they are traded automatically when the threshold is achieved.

    1. Mark Soberman says:

      You will book your gains officially when you exit. Otherwise it’s an unrealized gain. However, usually most people trading with ETFs are then re-investing. Unless we’ve turned bearish and there are no good choices. In that case you’ll be on the sidelines.

  5. brian garnett says:

    Hi,
    Could you please expand on this comment:
    “I personally like to enter best when I’m getting a buy signal – meaning the crossover and positive of the Power Score and Long Term Trend numbers.”
    What colours are you talking about for PS and LTT?
    thanks
    Brian

    1. Mark Soberman says:

      Hello. Thanks for the question. What I’m referring to is the actual value of the PS and LTT. So, if both are negative, or one is negative, I would wait until both cross-over the “0” value and are now both positive for the first time. That tends to be a solid time to enter with some momentum already behind the trade. It does typically end up that the colors are positive as well at this time but not required. Thanks.

  6. brian garnett says:

    Mark,
    Do you think you could use the above trigger on SPY as a general buy signal on the whole stockmarket on a medium to long term basis?

    1. Mark Soberman says:

      Yes, you could do that but assuming you were focusing on a broad based ETF like total market. If you are thinking specific sectors then not as much. It would be best to watch for crossovers on those specific ETFs (for example biotech, banking, utilities) Thanks.

  7. brian garnett says:

    Mark,
    If you enter on a pos/pos for a buy signal, what is the exit signal – the reverse?
    thanks

  8. George Calvert says:

    I would think that perhaps as long as the macro picture isn’t horrendous (as in 2008 when major financial firms were going bankrupt) that a person could maybe say that if the composite power score dips below 15% or so, that’s actually an ovesold buy signal.

    I see the table hasn’t been updated since 12/2016, has there been a lack of interest that caused you to not keep updating it? Thanks

    1. Mark Soberman says:

      Hello: Thanks for your comments and input. Appreciate it. Just so you are aware, we continue to update this table every week. You can see the latest readings here, as well as the monthly levels since the date you mention: http://www.netpicksetfinvestor.com/updated-etf-power-ratio-123016/

Leave a Reply

Ready To Fire Your Money Manager?

Free Access to the NetPicks ETF Investor - 100+ Top ETFs Analyzed

Subscribe