

iShares MSCI Germany EFT (EWG)
Thank you for reading this post, don't forget to subscribe!Key Statistics
Minor Support Level 24.78 Minor Resistance Level 29.33
Major Support Level 12.47 Major Resistance Level 34.81
Minor Buy Signal 30.10 Minor Sell Signal 24.40
Major Buy Signal 36.71 Major Sell Signal 10.63
BRIEF OVERVIEW
Is the global economy on the verge of a recession? As we enter 2019, the major investment firms on Wall Street are evenly divided on this particular topic. Without question, the firms who are able to accurately forecast the start of the next global recession will be able to provide invaluable investment advice to their clients. Unfortunately, those who miss the next economic contraction will put their clients at a tremendous disadvantage. This explains why the highest paid professionals on Wall Street are economists and analysts who specialize in forecasting macro-economic data.
In order to determine the current state of the global economy, we need to highlight the countries that generate the largest output of goods and services. These countries are the engines of global economic growth. Please examine the following list.
Global Economic Growth
Top 10 Countries
Country GDP Population 2019 Growth Forecast
United States 19.39 328.116 2.5%
China 12.01 1,396.982 6.2%
Japan 4.87 126.431 1.1%
Germany 3.68 82.786 1.3%
United Kingdom 2.62 66.466 1.5%
India 2.61 1,334.221 7.5%
France 2.58 65.098 1.5%
Brazil 2.05 209.205 2.5%
Italy 1.93 60.756 0.6%
Canada 1.65 37.098 1.9%
Source International Monetary Fund | GDP Trillion US Dollars | Population in Millions
As you can see from the table, the United States and China are clearly the leaders in terms of the global production of goods and services. In fact, these two countries are responsible for generating 39.3% of global GDP. Going forward into 2019, both countries are forecasted to create decent economic growth.
The countries on the list that appear to be struggling are the countries from Europe that are linked to the European Union (EU). The countries include Germany, France and Italy. The average combined growth rate for 2019 is only 1.1% for these three EU countries.
For those of you who may not be familiar with the EU, it is a political and economic union consisting of 28 member states located throughout the continent of Europe. Although the EU has been in existence since 1951, it didn’t obtain its present day format until 1999, when the member states adopted the Euro as their common currency.
The original intent of the EU was to become the “United States of Europe.” Most financial historians and professional economists would agree that the EU has fallen well short of its lofty goal to be on the same playing field as the United States from an economic perspective. Despite its inability to generate the same level of economic growth as the US, the European Union is still a major contributor to global GDP growth.
Among the 28 members of the EU, Germany is easily the most important country in terms of economic output. In 2018, total GDP for the European Union was $18.162 trillion. Germany accounted for $3.93 trillion, followed by France @ $2.660 trillion and Italy @ $2.050 trillion. Germany was responsible for generating 21.6% of all goods and services produced within the European Union for 2018. As you can see, Germany plays a vital role in global economy.
Since the end of World War II, the majority of global recessions have started on the continent of Europe. Why does this phenomenon occur? Why is Europe responsible for kick-starting most recessions? Let’s briefly review the details.
Without getting too technical, global economic contractions originate in the Eurodollar market. The Eurodollar is not a currency. Instead, it is an interest rate product used for short-term lending between countries. More specifically, they are dollar-denominated bank deposits held outside the United States, particularly in Europe. As the demand for Eurodollars begins to contract, this usually marks the beginning of a slowdown in global trading. This phenomenon usually originates throughout Europe, particularly in Germany. Consequently, many economists, hedge funds, investment advisors and Wall Street traders pay attention to economic conditions in Germany. The country is the bellwether for all other European countries.
The iShares family of exchange traded funds (managed by BlackRock) introduced the MSCI Germany ETF, with the objective of providing investors with exposure to economic conditions throughout Germany. The ETF was launched on 12 March 1996, using the ticker symbol EWG. The ETF has 65 different holdings. The top five holdings include SAP, Allianz, Siemens AG, Bayer AG and BASF. The current 52-week trading range is 24.40 to 33.41.
SHORT-TERM VIEW
Despite the recent advance, the bears are in control of the short-term momentum. The next level of support is 24.78. In order to reclaim the momentum, the bulls need a weekly close above 29.33. Based on the recent strong advance in the equity markets, the path of least resistance appears to be reversing to the upside.
LONG-TERM VIEW
As we briefly discussed, Germany plays a critical role in determining the starting point for the next global recession. Is the German economy on the verge of an economic contraction? Is the global economy rolling over to the downside? Let’s examine the numbers.
Germany Economic Growth
2016 – 2018
Country Date GDP Growth Rate Annual Growth Rate
Germany Q1 2016 0.9% 2.4%
Germany Q2 2016 0.4% 2.3%
Germany Q3 2016 0.2% 2.0%
Germany Q4 2016 0.4% 1.9%
Germany Q1 2017 1.1% 2.1%
Germany Q2 2017 0.5% 2.2%
Germany Q3 2017 0.6% 2.6%
Germany Q4 2017 0.5% 2.8%
Germany Q1 2018 0.4% 2.1%
Germany Q2 2018 0.5% 2.0%
Germany Q3 2018 0.2% (-) 1.1%
Germany Q4 2018 0.0% 0.6%
Source Trading Economics
Germany Rate of Inflation
2018 – 2019
Country Date Consumer Inflation Core Inflation
Germany Feb 2018 1.1% 1.3%
Germany Mar 2018 1.5% 1.5%
Germany Apr 2018 1.3% 1.1%
Germany May 2018 2.1% 1.6%
Germany Jun 2018 1.9% 1.2%
Germany Jul 2018 1.9% 1.2%
Germany Aug 2018 1.9% 1.3%
Germany Sep 2018 1.9% 1.3%
Germany Oct 2018 2.3% 1.7%
Germany Nov 2018 2.1% 1.3%
Germany Dec 2018 1.6% 1.2%
Germany Jan 2019 1.4% 1.3%
Source Trading Economics
Germany Interest Rates
2018 – 2019
Country Date Interbank Rate Benchmark Rate
Germany Feb 2018 .328% (-) 0.0%
Germany Mar 2018 .328% (-) 0.0%
Germany Apr 2018 .328% (-) 0.0%
Germany May 2018 .325% (-) 0.0%
Germany Jun 2018 .322% (-) 0.0%
Germany Jul 2018 .321% (-) 0.0%
Germany Aug 2018 .319% (-) 0.0%
Germany Sep 2018 .319% (-) 0.0%
Germany Oct 2018 .318% (-) 0.0%
Germany Nov 2018 .316% (-) 0.0%
Germany Dec 2018 .312% (-) 0.0%
Germany Jan 2019 .308% (-) 0.0%
Source Trading Economics
In order to examine the economic health of a particular country, most economists will focus on gross domestic product (GDP), rate of inflation and the level of interest rates within the country’s banking sector. If we examine these numbers within the German economy, it becomes quite clear that the current state of the German economy is rather anemic. In fact, the entire EU economy is performing quite poorly. With the exception of Japan, all G20 economies are growing at a faster pace than Germany (as well as the remaining countries that comprise the European Union).
Germany’s economic growth actually decelerated throughout 2018. In fact, the country experienced negative growth in Q3 2018 and 0.0% growth in Q4 2018. Germany (like many G20 countries) has been unable to achieve the same level of GDP growth that it enjoyed prior to the financial crisis of 2008. According to most financial experts, 2019 will be another stagnant year for its domestic economy.
In terms of its inflation rate, Germany has been unable to reach its target goal of 2.0% annual inflation for the past several years. Typically, countries prefer low levels of inflation. However, chronically low levels of inflation for an extended period of time is usually the sign of an unhealthy economy. Germany has been struggling with low inflation since the financial crisis of 2008. The goal of the European Central Bank (ECB) has been to create pro-growth economic policies which will encourage domestic consumption. So far, the policies of the ECB have been ineffective.
In a desperate attempt to accelerate economic growth, the ECB embarked on a controversial “negative interest rate” policy beginning in June 2014. The central bank actually charged its member banks a fee (in the form of negative rates) to hold overnight deposits with the ECB. The objective of this policy was to disincentivize member banks from holding funds with the ECB. Instead, the banks were encouraged to make new loans to businesses and consumers in an effort to create economic growth. The policy has been in effect for almost five years. So far, it has been a colossal failure. Negative interest rates have not resulted in an improving economy. As you can see from the table, interest rates continue to remain in negative territory. At least for now, the ECB has no plans to reverse its negative interest rate policy.
Based on our review of Germany’s three pillars of economic health (GDP, inflation rate and interest rates), will the German economy slip into a recession, thus creating a “snowball effect” for the entire global economy? Most likely, Germany will experience a mild recession throughout 2019 and 2020. However, the recession (if it occurs) will not be strong enough to ignite a global recession. Germany experienced a similar situation in 2016. The domestic economy slowed down. However, it was not strong enough to push the global economy into a recession.
The “perma-bears” who are constantly forecasting another financial crisis, will probably be disappointed in 2019. The German economy, along with all of Europe, will not push the world into a nasty recession.
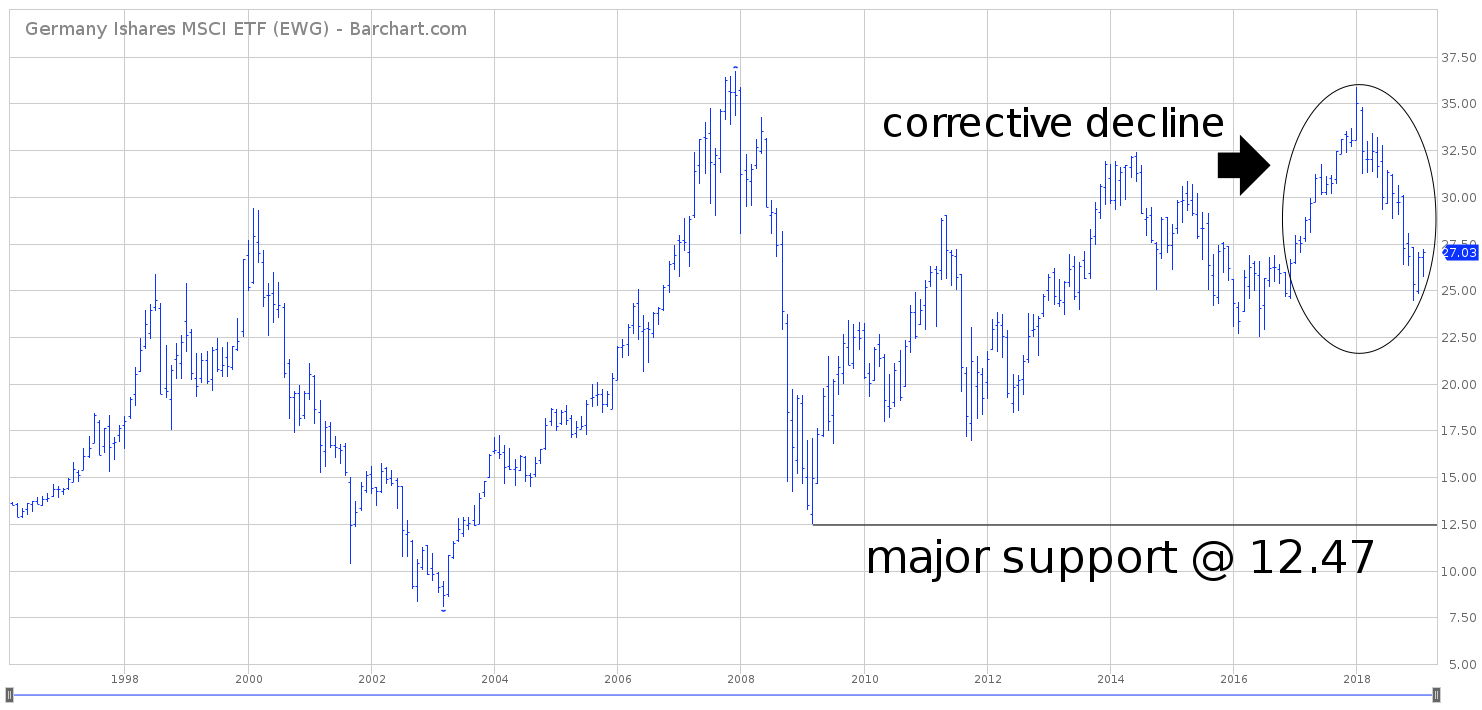
In regard to EWG, despite the rather steep decline since January 2018, the long-term view is bullish. This is nothing more than a corrective decline in an overbought market. In order to reverse the momentum, the bears need a weekly close below 12.47 (highly unlikely any time in the near future).
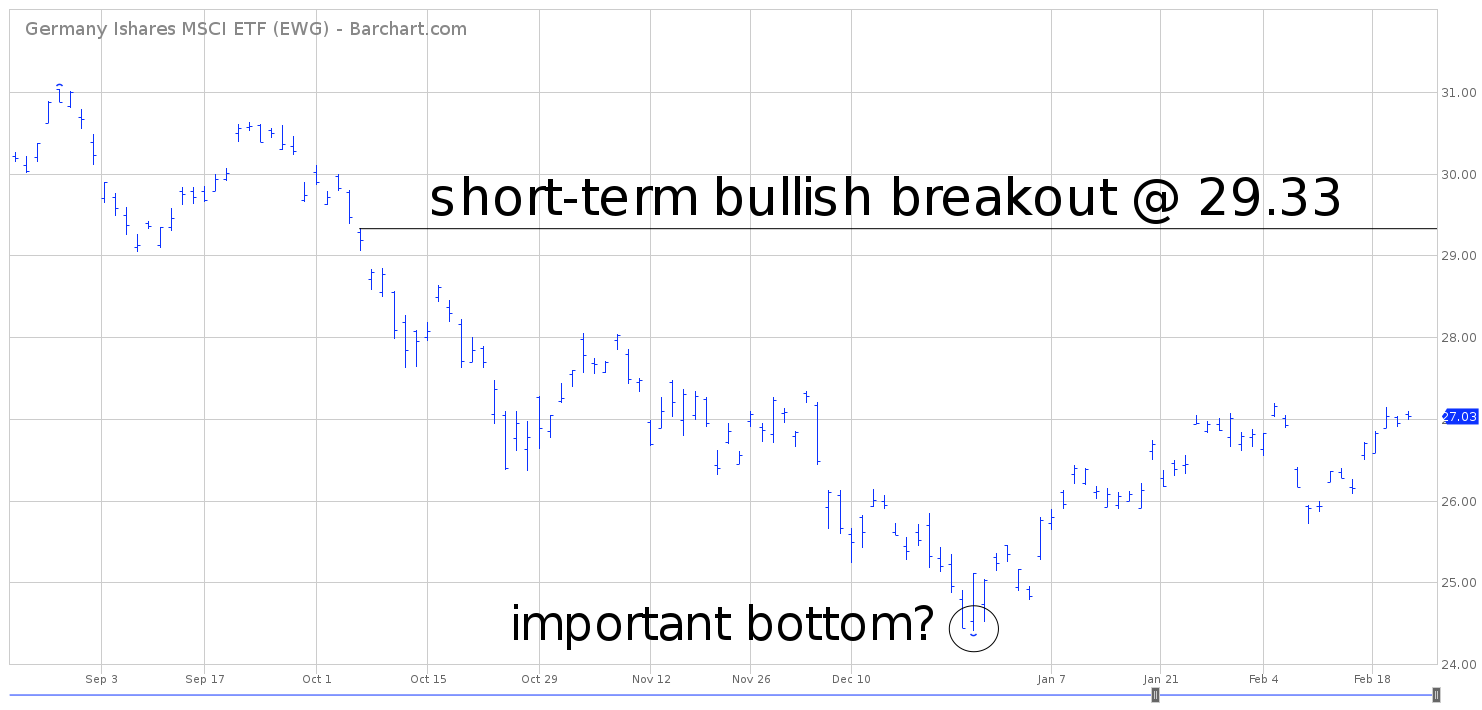
SHORT-TERM CHART – EWG
Please review the 6-month chart of EWG. The chart pattern is currently in favor of the bears. However, it does appear that an important bottom was formed on 26 December @ 24.40. The short-term trend will turn bullish on a weekly close above 29.33.
LONG-TERM CHART
Please review the 23-year chart of EWG. This chart covers the entire trading history of the ETF. The bulls are in control of the long-term trend. The recent 12-month decline is nothing but a correction in an overextended market. In order to reverse the bullish chart pattern, the bears need a weekly close below 12.47, which will only occur if the overall stock market experiences a massive bear market. For now, the most likely scenario is an eventual new high above 36.71.

