

Consumer Discretionary Select Sector SPDR Fund EFT (XLY)
Key Statistics – XLY Consumer Discretionary ETF
Thank you for reading this post, don't forget to subscribe!
Minor Support Level 94.06 Minor Resistance Level 112.15
Major Support Level 33.07 Major Resistance Level 118.13
Minor Buy Signal 114.80 Minor Sell Signal 91.73
Major Buy Signal 121.46 Major Sell Signal 30.61
BRIEF OVERVIEW
What are consumer discretionary items and why are they such an important part of our nation’s economy? Please review the following list.
Consumer Discretionary Items
- Durable Goods
- Apparel
- Entertainment
- Leisure
- Automobiles
- Household Furniture
- Food Services
- Lodging
- Printing and Publishing
As the name implies, discretionary items are purchased with consumer discretionary income.
These items are considered non-essential by consumers. Typically, the items are purchased only if the consumer has the available income at the time of purchase.
The purchase of discretionary goods and services is heavily influenced by the state of the domestic economy. Consequently, these items can be used as an excellent barometer in determining the current trend of economic growth. In a weak economy, consumers are more likely to postpone (or completely bypass) the purchase of discretionary items in favor of adding to their savings.
The level of discretionary spending can also affect consumer confidence and consumer sentiment, which has a huge impact on the overall economy. Why? Because consumer spending accounts for 70% of the US economy. When consumers don’t feel confident about the future direction of the domestic economy, they have a tendency to alter their spending habits. For example, if a consumer doesn’t have a sense of security concerning her/his employment situation, the consumer will reduce discretionary spending. Without question, consumer confidence and consumer sentiment have a “trickle-down effect” on the overall economy, including discretionary spending habits.
Of course, consumer discretionary spending has a direct impact on the companies that produce discretionary goods and services. These companies are heavily dependent on consumer spending habits and consumer confidence. The financial performance of consumer discretionary firms is an excellent indicator of future economic conditions and stock market performance. This explains why financial advisors and investment professionals are constantly monitoring consumer discretionary spending as well as the companies that are directly involved in the industry.
In an effort to provide investors with exposure to consumer discretionary spending, the SPDR family of exchange traded funds (distributed by State Street Global Advisors) launched the Consumer Discretionary Select Sector SPDR Fund ETF on 16 December 1998. The ticker symbol is XLY. The ETF provides investors with an opportunity to invest in some of the largest and most liquid consumer discretionary companies. XLY has a total of 65 different holdings. The top five companies include Amazon.com Inc, Home Depot Inc, McDonald’s Corporation, Nike Inc Class B shares and Starbucks Corporation.
SHORT-TERM VIEW – XLY Consumer Discretionary ETF
XLY suffered a fairly sharp decline during the final 60 days of 2018, along with the overall stock market. However, the ETF has enjoyed a nice recovery since the beginning of 2019. Currently, the short-term view of XLY is neutral. The important numbers to watch are 94.06 and 112.15. At least for now, the most likely scenario is a resolution to the upside above 112.15.
LONG-TERM VIEW – XLY Consumer Discretionary ETF
As we discussed earlier, consumer discretionary spending is a vital component of our nation’s economy. The United States measures its economy based on gross domestic product (GDP). Consumer spending accounts for 70% of GDP. Therefore, in terms of the US economy, nothing is more important than the spending habits of the American consumer, including consumer confidence and consumer sentiment. Let’s review a few of the main categories concerning discretionary spending and consumer income.
Consumer Discretionary Spending
Retail Sales (2008 – 2017)
Date Category Amount % Change
2008 Retail Sales 3.94 (1.5%)
2009 Retail Sales 3.61 (8.4%)
2010 Retail Sales 3.82 5.8%
2011 Retail Sales 4.10 7.3%
2012 Retail Sales 4.30 4.9%
2013 Retail Sales 4.46 3.7%
2014 Retail Sales 4.64 4.0%
2015 Retail Sales 4.73 1.9%
2016 Retail Sales 4.86 2.7%
2017 Retail Sales 5.08 4.5%
Source Statista | Trillion US Dollars
Consumer Discretionary Spending
Vehicle Sales (2008 – 2017)
Date Category Amount % Change
2008 Vehicle Sales 13.49 (18.0%)
2009 Vehicle Sales 10.60 (21.4%)
2010 Vehicle Sales 11.77 11.0%
2011 Vehicle Sales 13.05 10.9%
2012 Vehicle Sales 14.78 13.3%
2013 Vehicle Sales 15.88 7.4%
2014 Vehicle Sales 16.86 6.2%
2015 Vehicle Sales 17.84 5.8%
2016 Vehicle Sales 17.86 0.1%
2017 Vehicle Sales 17.56 (1.7%)
Source St Louis Federal Reserve | Sales in millions
Consumer Discretionary Spending
Durable Goods (2008 – 2017)
Date Category Amount % Change
2008 Durable Goods 216,110 (6.1%)
2009 Durable Goods 153,457 (21.4%)
2010 Durable Goods 188,913 23.1%
2011 Durable Goods 208,530 10.4%
2012 Durable Goods 219,578 5.3%
2013 Durable Goods 226,013 2.9%
2014 Durable Goods 236,320 4.6%
2015 Durable Goods 224,577 (5.0%)
2016 Durable Goods 220,667 (1.7%)
2017 Durable Goods 232,650 5.4%
Source St Louis Federal Reserve | Million US Dollars
Consumer Discretionary Spending
Consumer Sentiment (2008 – 2017)
Date Category Index % Change
2008 Consumer Sentiment 63.8 (25.5%)
2009 Consumer Sentiment 66.3 3.9%
2010 Consumer Sentiment 71.8 8.3%
2011 Consumer Sentiment 67.4 (6.1%)
2012 Consumer Sentiment 76.5 13.5%
2013 Consumer Sentiment 79.2 3.5%
2014 Consumer Sentiment 84.1 6.2%
2015 Consumer Sentiment 92.9 10.5%
2016 Consumer Sentiment 91.8 (1.2%)
2017 Consumer Sentiment 96.8 5.4%
Source St Louis Federal Reserve
Consumer Income
Personal Income (2008 – 2017)
Date Category Amount % Change
2008 Personal Income 12,442 3.6%
2009 Personal Income 12,059 (3.1%)
2010 Personal Income 12,552 4.1%
2011 Personal Income 13,327 6.2%
2012 Personal Income 14,010 5.1%
2013 Personal Income 14,181 1.2%
2014 Personal Income 14,992 5.7%
2015 Personal Income 15,719 4.8%
2016 Personal Income 16,125 2.6%
2017 Personal Income 16,831 4.4%
Source St Louis Federal Reserve | Billion US Dollars
Please note: The 2018 numbers won’t be available until mid-February due to the shutdown of the federal government.
As you can see from the tables, discretionary spending, consumer sentiment and personal income have been moving steadily higher since the financial crisis of 2008-09. Although the official numbers have not been released for 2018, private forecasters have stated that 2018 was another strong year for discretionary spending and personal income.
For the past two years, a growing number of Wall Street economists have been forecasting a recession in the United States. These forecasts have been completely wrong. Based on the economic data, a recession is highly unlikely any time in the near future. This would seem to indicate that the recent decline in the stock market was nothing but a correction in a secular bull market (very similar to the correction in early-2016).
Many economists and financial analysts are under the impression that the US economy is “overdue” for a recession. To a certain extent, this is correct. The last recession in the United States occurred ten years ago in 2009. Based on historical data, our nation experiences a recession every five years (dating back to 1945). However, economic expansions don’t die of old age. Therefore, the current expansion could easily continue well into 2020. There is no rule which says that the United States must have a recession every five years. Our nation’s current economic expansion will probably exceed most investors’ expectations. As a side note, the country of Australia has not experienced a recession since 1993.
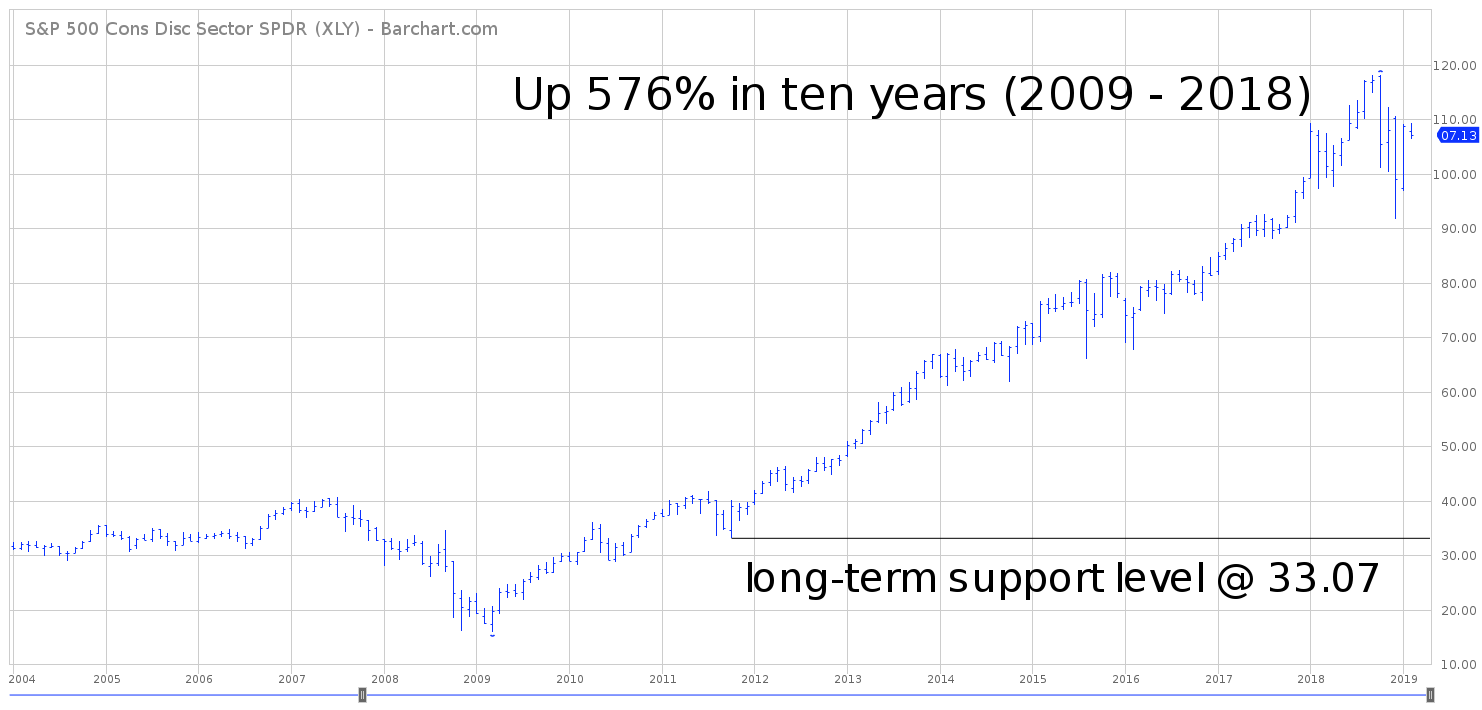
In regard to the long-term view of XLY, the bulls are in complete control of the ETF. XLY has enjoyed a dramatic rally over the course of the past decade. In order to reverse the long-term momentum, the bears need a weekly close below 33.07. It would take a substantial stock market decline to push XLY below 33.07, which is highly unlikely any time in the near future.
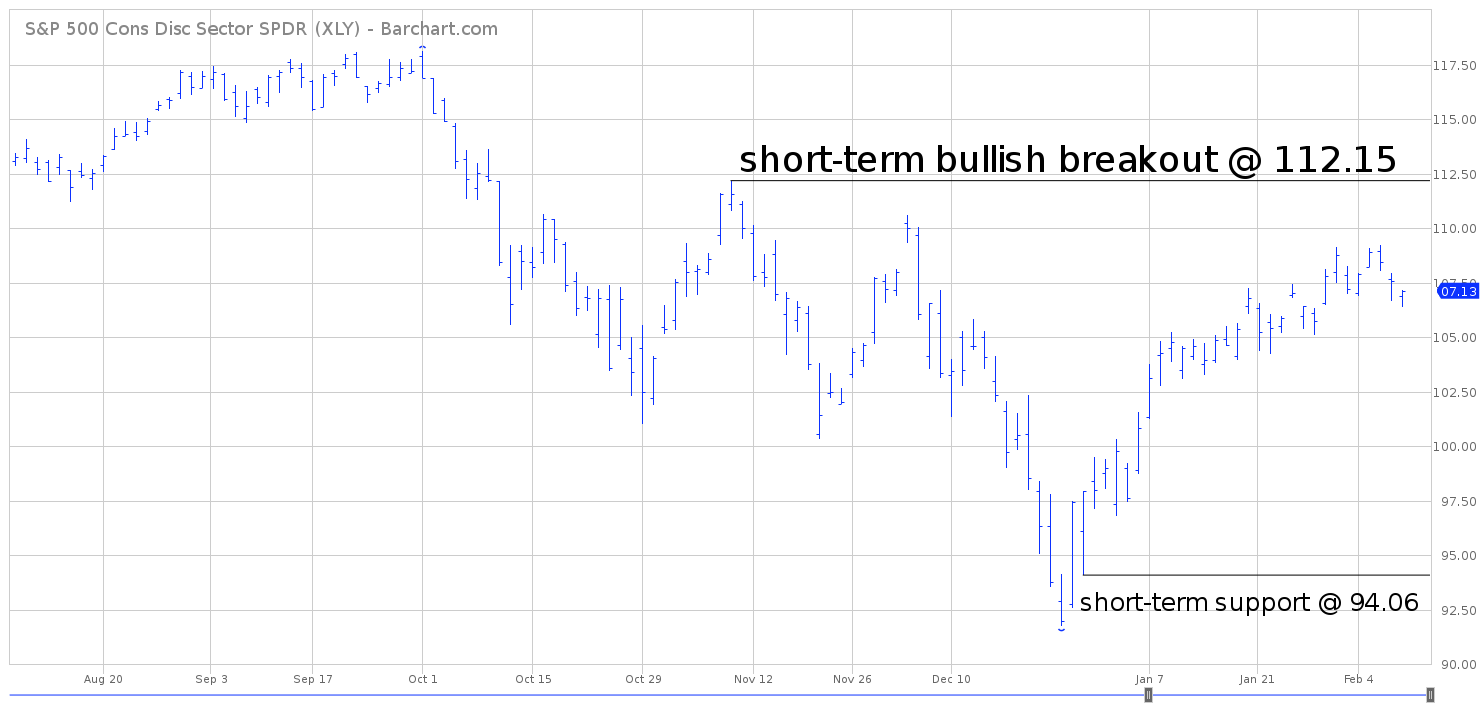
SHORT-TERM TREND – XLY Consumer Discretionary ETF
Please review the 6-month chart of XLY. Despite the strong rally during the past 60 days, the chart pattern is hovering in neutral territory. There is a battle between the bulls and the bears.
The important numbers to watch are 94.06 and 112.15. At least for now, the most likely scenario is a bullish breakout above 112.15.
LONG-TERM TREND
Please review the 15-year chart of XLY. The ETF has enjoyed an incredible rally following the global financial crisis in 2008. XLY has been in a relentless bull market for the past decade. Since March 2009, XLY has advanced 576%. Did XLY form a major top in October 2018? Most likely, the answer is “No.” The ETF was way overdue for a short-term correction. The bulls are in complete control of XLY. The first sign of trouble would be a weekly close 91.73. Officially, the bears need a weekly close below 33.07 to reverse the bullish trend (which is highly unlikely).

