SPDR Dow Jones Industrial Average ETF (DIA)
Thank you for reading this post, don't forget to subscribe!
BRIEF OVERVIEW DIA ETF
Ever since stocks began trading on Wall Street in 1792, traders and investors have developed their own theories on what causes the stock market to rise and fall. In fact, many economists and members of academia have devoted their entire professional careers trying to determine the main contributing factors to stock market fluctuates. A few of these theories have been so convincing that the authors were awarded a Nobel Prize for their efforts.
Despite decades of research and analysis, most participants who play the game of stock market speculation are still unable to accurately determine why prices fluctuate. A few of the more popular theories on what causes stocks to gyrate back and forth include: Federal Reserve monetary policy (i.e. interest rates), strength or weakness in the domestic economy, inflation rate, corporate earnings, chart patterns and other technical indicators, insider buying/selling and sector rotation. In reality, there is no single piece of data which is responsible for precipitating movements in the equity markets. Instead, it’s probably a combination of data and market sentiment which ultimately drives stock prices.
Many of the world’s greatest investors have argued for decades that there exists a single driving force which has the ability to dramatically influence economic data and stock market sentiment. This driving force tends to conjure up heated debates within the investment community and also outside of the investment community. Of course, we are referring to the subject of politics. Arguably, politics is the most emotional topic within the US population. Most US citizens have a very emotional response when the subject of politics is mentioned.
Given the fact that politics is such a “hot topic,” does it have the predictive ability to move the overall stock market. In other words, does it really matter which political party has control over the White House? Is the stock market influenced by our political leaders? If the answer is “Yes,” which party has the best track record in terms of stock market performance? Of course, the best way to answer this question is to calculate the stock market’s annual rate of return and compare it to each Presidential term. Stock market returns were based on the Dow Jones Industrial Average (DJIA). Before we analyze the results of each political party, let’s briefly review the ETF that most resembles DJIA.
The SPDR family of exchange traded funds (underwritten by State Street Global Advisors) introduced the Dow Jones Industrial Average ETF on 14 January 1998. The ticker symbol is DIA. This ETF is a perfect vehicle for investors who wish to participate in the performance of DJIA. DIA is an extremely popular ETF, with an average daily volume of nearly six million shares. The ETF is commonly referred to as “Diamonds.”
LONG-TERM VIEW
Do political parties have a direct influence on the stock market? Let’s examine the data. Please review the following tables.
DJIA Performance Results
1947 – 1962
Year US President Party Dow Jones Index
1947 Harry S Truman Democratic 2.2%
1948 Harry S Truman Democratic (2.1%)
1949 Harry S Truman Democratic 13.1%
1950 Harry S Truman Democratic 17.4%
1951 Harry S Truman Democratic 14.4%
1952 Harry S Truman Democratic 8.4%
1953 Dwight D Eisenhower Republican (3.8%)
1954 Dwight D Eisenhower Republican 44.0%
1955 Dwight D Eisenhower Republican 20.8%
1956 Dwight D Eisenhower Republican 2.3%
1957 Dwight D Eisenhower Republican (12.8%)
1958 Dwight D Eisenhower Republican 34.0%
1959 Dwight D Eisenhower Republican 16.4%
1960 Dwight D Eisenhower Republican (9.3%)
1961 John F Kennedy Democratic 18.7%
1962 John F Kennedy Democratic (10.8%)
Source whitehouse.gov | barchart.com
DJIA Performance Results
1963 – 1978
Year US President Party Dow Jones Index
1963 Lyndon B Johnson Democratic 17.0%
1964 Lyndon B Johnson Democratic 14.6%
1965 Lyndon B Johnson Democratic 10.9%
1966 Lyndon B Johnson Democratic (18.9%)
1967 Lyndon B Johnson Democratic 15.2%
1968 Lyndon B Johnson Democratic 4.3%
1969 Richard Nixon Republican (15.2%)
1970 Richard Nixon Republican 4.8%
1971 Richard Nixon Republican 6.1%
1972 Richard Nixon Republican 14.6%
1973 Richard Nixon Republican (16.6%)
1974 Gerald Ford Republican (27.6%)
1975 Gerald Ford Republican 38.3%
1976 Gerald Ford Republican 17.9%
1977 Jimmy Carter Democratic (17.3%)
1978 Jimmy Carter Democratic (3.1%)
Source whitehouse.gov | barchart.com
DJIA Performance Results
1979 – 1994
Year US President Party Dow Jones Index
1979 Jimmy Carter Democratic 4.2%
1980 Jimmy Carter Democratic 14.9%
1981 Ronald Reagan Republican (9.2%)
1982 Ronald Reagan Republican 19.6%
1983 Ronald Reagan Republican 20.3%
1984 Ronald Reagan Republican (3.7%)
1985 Ronald Reagan Republican 27.7%
1986 Ronald Reagan Republican 22.6%
1987 Ronald Reagan Republican 2.3%
1988 Ronald Reagan Republican 11.8%
1989 George H W Bush Republican 27.0%
1990 George H W Bush Republican (4.3%)
1991 George H W Bush Republican 20.3%
1992 George H W Bush Republican 4.2%
1993 Bill Clinton Democratic 13.7%
1994 Bill Clinton Democratic 2.1%
Source whitehouse.gov | barchart.com
DJIA Performance Results
1995 – 2010
Year US President Party Dow Jones Index
1995 Bill Clinton Democratic 33.4%
1996 Bill Clinton Democratic 26.0%
1997 Bill Clinton Democratic 22.6%
1998 Bill Clinton Democratic 16.1%
1999 Bill Clinton Democratic 25.2%
2000 Bill Clinton Democratic (6.2%)
2001 George W Bush Republican (7.1%)
2002 George W Bush Republican (16.8%)
2003 George W Bush Republican 25.3%
2004 George W Bush Republican 3.1%
2005 George W Bush Republican (0.6%)
2006 George W Bush Republican 16.3%
2007 George W Bush Republican 6.4%
2008 George W Bush Republican (33.8%)
2009 Barack Obama Democratic 18.8%
2010 Barack Obama Democratic 11.0%
Source whitehouse.gov | barchart.com
DJIA Performance Results
2011 – 2018
Year US President Party Dow Jones Index
2011 Barack Obama Democratic 5.5%
2012 Barack Obama Democratic 7.3%
2013 Barack Obama Democratic 26.5%
2014 Barack Obama Democratic 7.5%
2015 Barack Obama Democratic (2.2%)
2016 Barack Obama Democratic 13.4%
2017 Donald Trump Republican 25.1%
2018 Donald Trump Republican (5.6%)
Source whitehouse.gov | barchart.com
Presidential Performance
1947 – 2018
Years US President Party Avg Annual Return
1947 – 1952 Harry S Truman Democratic 8.9%
1953 – 1960 Dwight D Eisenhower Republican 11.4%
1961 – 1963 John F Kennedy Democratic 3.9%
1963 – 1968 Lyndon B Johnson Democratic 7.2%
1969 – 1973 Richard Nixon Republican (1.3%)
1974 – 1976 Gerald Ford Republican 9.5%
1977 – 1980 Jimmy Carter Democratic 0.3%
1981 – 1988 Ronald Reagan Republican 11.4%
1989 – 1992 George H W Bush Republican 11.8%
1993 – 2000 Bill Clinton Democratic 16.6%
2001 – 2008 George W Bush Republican (0.9%)
2009 – 2016 Barack Obama Democratic 11.0%
2017 – 2018 Donald Trump Republican 9.7%
Source whitehouse.gov | barchart.com
Presidential Performance
1947 – 2018
Years US President Party Avg Annual Return
1993 – 2000 Bill Clinton Democratic 16.6%
1989 – 1992 George H W Bush Republican 11.8%
1981 – 1988 Ronald Reagan Republican 11.4%
1953 – 1960 Dwight D Eisenhower Republican 11.4%
2009 – 2016 Barack Obama Democratic 11.0%
2017 – 2018 Donald Trump Republican 9.7%
1974 – 1976 Gerald Ford Republican 9.5%
1947 – 1952 Harry S Truman Democratic 8.9%
1963 – 1968 Lyndon B Johnson Democratic 7.2%
1961 – 1963 John F Kennedy Democratic 3.9%
1977 – 1980 Jimmy Carter Democratic 0.3%
2001 – 2008 George W Bush Republican (0.9%)
1969 – 1973 Richard Nixon Republican (1.3%)
Source whitehouse.gov | barchart.com
As you can see from the tables, the political data was analyzed from 1947 to 2018. Therefore, 72 years of information was collected. Specifically, what conclusions can we draw from this material? The most important piece of data that can be gleaned from these tables is the fact that Democratic administrations have historically generated higher stock market returns versus their Republican counterparts. Without question, these results fly in the face of conventional wisdom, particularly on Wall Street. The vast majority of Wall Street professionals have always considered Republican administrations to be “pro-business” in comparison to Democrats. Based on 72 years of data, this is simply not true.
Since 1947, Democratic administrations have produced an average annual return of 9.5%. Republican administrations have yielded an average annual return of 7.0%. Therefore, Democrats have easily outperformed Republicans. Most professional investors and financial advisors would agree that an average annual increase of 2.5% would dramatically improve the long-term value of an investor’s portfolio.
Of course, there is no guarantee that this trend will continue in the future. However, at least for now, the Democrats have the upper hand.
In terms of individual results, President Clinton easily achieved the highest average annual return at 16.6%. Clinton had the benefit of being President during the internet mania, which turned out to be a huge boost for the domestic economy. Of course, political pundits will argue that Clinton’s economic policies were the driving force behind the technology boom of the 1990s. To a certain extent, the pundits are probably correct. President Clinton was a centrist in terms of his economic agenda. His policies were quite favorable to new businesses and start-up companies.
Despite the fact that President Clinton was a Democrat, his views on government regulation were extremely conservative, particularly in regard to Wall Street. Clinton pushed for deregulation, which allowed the major banks and investment firms on Wall Street to provide cheap financing for start-up technology companies.
George H W Bush and Ronald Reagan followed behind Clinton in regard to stock market performance. Presidential historians will surmise that “Reaganomics” was responsible for the strong rate of return during the Reagan years and the Bush years. During the past 30+ years, economists have engaged in heated debates concerning whether or not Reagan’s “trickle down” economic policies were beneficial to the domestic economy. Most likely, this debate will continue well into the future. However, there is no disputing the fact that the stock market performed incredibly well during the “Reaganomics” years. In fact, it was so successful that George H W Bush was able to ride the coattails of Reagan’s economic policies during the first few years of his presidency.
The next Presidential election will occur in less than 12 months. It will be very interesting to see how the stock market reacts to our nation’s next President. Most likely, there will be a tremendous amount of volatility as we draw closer to election day on 3 November 2020.
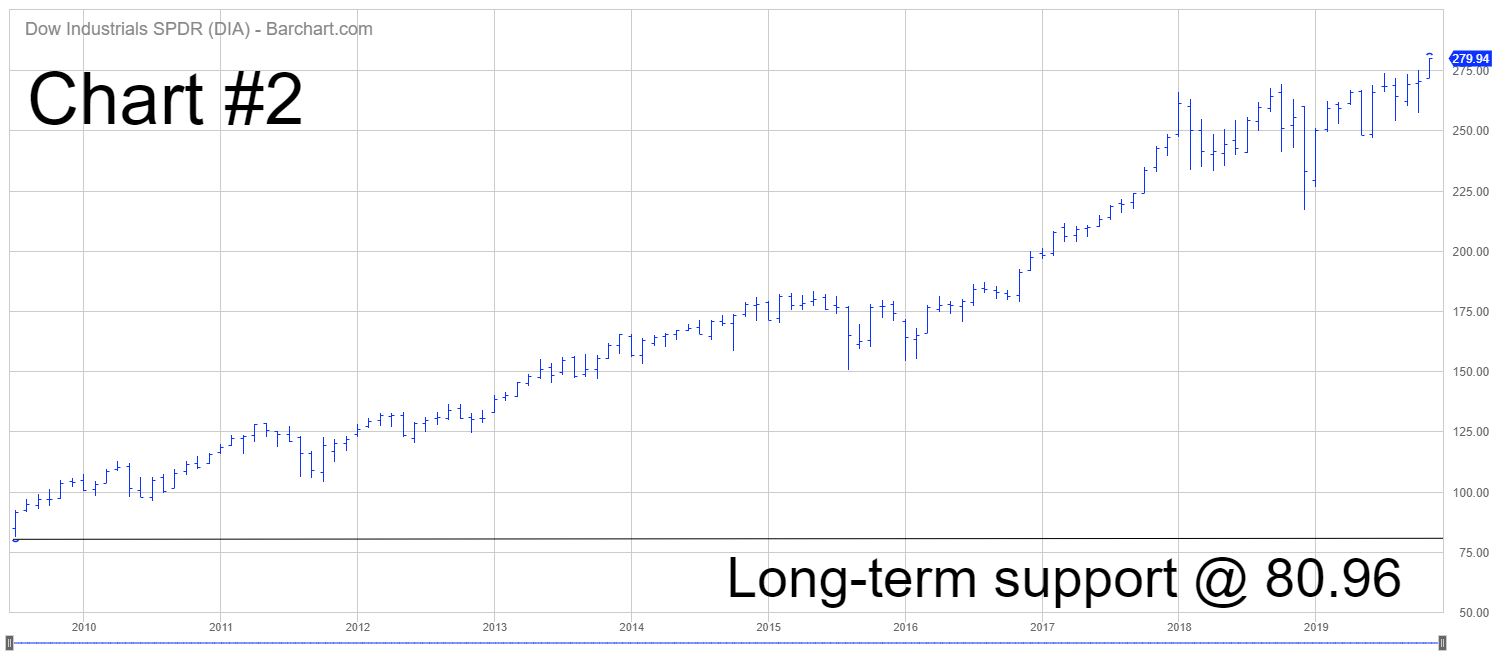
In terms of the current trend, the bulls are in complete control of DIA. At least for now, theupcoming Presidential election has not changed the long-term bullish momentum. The next resistance level is 292.84. In order for the bears to gain the upper hand, a weekly close below 80.96 is needed.
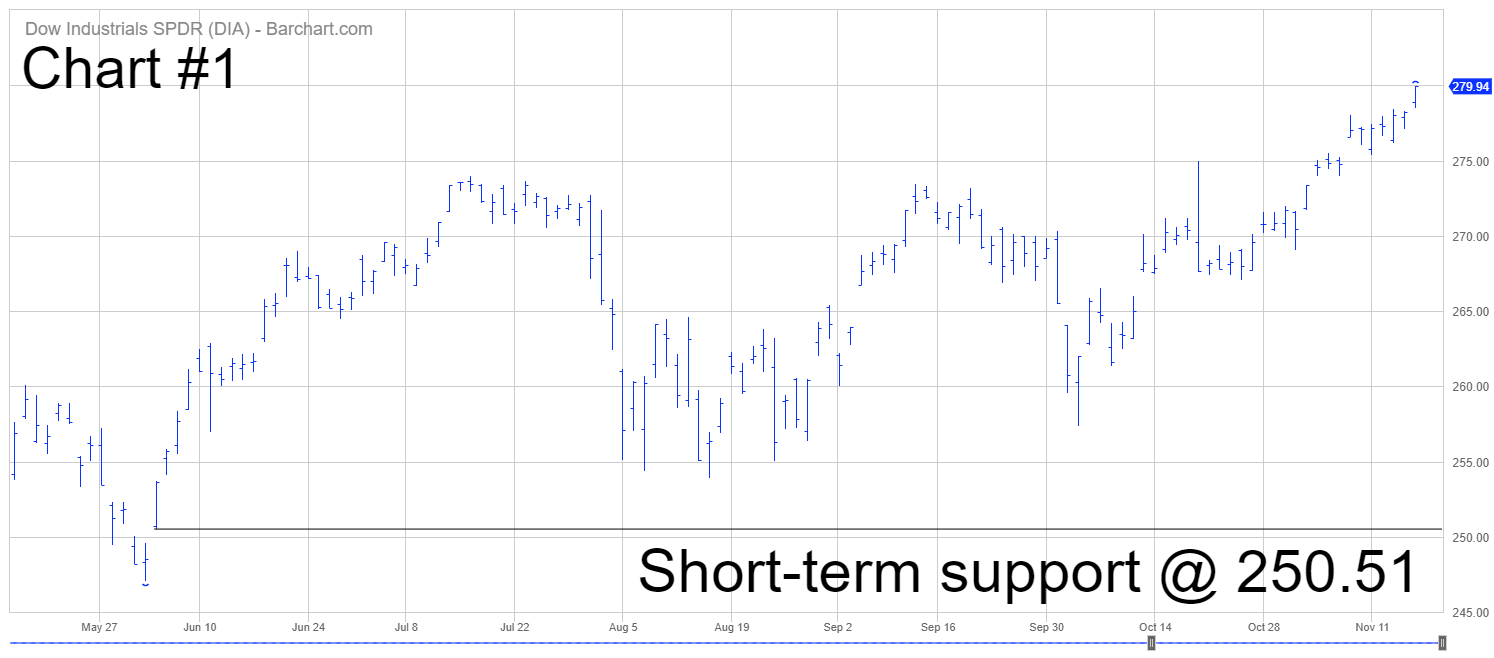
LONG-TERM CHART DIA ETF
Please review the attached 10-year chart of DIA (Chart #2). The bulls are in complete control of the long-term chart pattern. The next resistance level is 292.84. In order for the bears to gain the upper hand, a weekly close below 80.96 is needed. The bulls have been in control of the long-term trend for several years. Eventually, the trend will flip from bullish to bearish. The 2020 Presidential election could be the catalyst.