US Oil Fund USO Exchange Traded Fund
Key Statistics – prices as of 11/9/17
Thank you for reading this post, don't forget to subscribe!Daily High 11.55 Short-Term Trend Bullish
Daily Low 11.40 Intermediate-Term Trend Bullish
Daily Close 11.46 Long-Term Trend Bullish
Minor Support Level 10.55 Minor Resistance Level 11.94
Major Support Level 8.14 Major Resistance Level 42.30
Minor Buy Signal 12.00 Minor Sell Signal 10.39
Major Buy Signal 45.60 Major Sell Signal 7.67
SHORT-TERM VIEW – US Oil Fund USO
Crude oil is arguably the most important industrial commodity on the planet. It is the single biggest source of primary energy. Crude oil accounts for 30% of all energy used by humans. This explains why investors are keenly interested in trying to determine its future direction.
United States Commodity Funds LLC introduced a crude oil tracking ETF in April 2006. It trades under the ticker symbol USO. It tracks the price of crude oil using the West Texas Intermediate (WTI) crude oil spot futures contract traded on the New York Mercantile Exchange. USO is an extremely popular product within the ETF investment community. The average daily volume during the past 90 days is approximately 18 million shares. The ETF has 196.9 million shares outstanding.
USO recorded an important bottom on June 21st @ 8.65. The ETF has been moving steadily higher for the past 4 ½ months, as the price of crude oil has advanced about $14 per barrel.
The bulls are in complete control of USO. All three of the trend following momentum indicators are in bullish territory. The next important short-term resistance level for USO is 11.94. In order to regain the downside momentum, the bears need a weekly close below 10.55.
Based on the Aroon Oscillator, USO has an overbought reading of +92. The Aroon Oscillator is programmed differently than most stochastic indicators. The oscillator fluctuates between
-100 and +100. A reading of 0 would indicate a neutral position. Therefore, a reading of +92 with USO is certainly near the extreme level of +100. According to Aroon, USO is overdue for a short-term decline.
LONG-TERM VIEW – US Oil Fund USO
The long-term view of USO is rather bearish. Despite the sharp rally during the past 20 months, the ETF is still hovering near the lower end of its long-term trading range. Since its inception in 2006, USO has fluctuated between 7.67 and 119.17. Based on its current price of 11.46, we must label USO as being in a bear market.
Given the fact that crude oil is the driving force behind the performance of USO, let’s take a long-term “big picture” view of the market.
In December 1998, the price fell to a 13-year low @ $10.98 per barrel. The world oil supply was completely out of balance with global demand. The majority of the supply glut was blamed on OPEC’s inability to prevent its members from cheating on their production quotas.
At the time in 1998, OPEC was producing approximately 40% of the world’s crude oil. As a result, they had a dramatic influence on the price.
In early 1999, the members of OPEC held a series of meetings in order to address the issue of overproduction and cheating. This marked the beginning of a massive 9-year bull market in crude oil. The market experienced a price increase of 1,241% from December 1998 through July 2008. Crude oil peaked @ $147.27 on July 14, 2008.
The record bull market ended with the great financial crisis of 2008. The price of crude oil plummeted from July 2008 through January 2009. The price dropped from $147 to $33 in less than six months.
Along with all other commodities, crude oil enjoyed a nice rally for the next few years as the Federal Reserve injected over $2 trillion into the banking system in order to stimulate our nation’s economy. The market enjoyed a substantial rally from 2009 through 2013, as prices increased from $33 to $114.
In 2014, OPEC found itself facing the same problems that plagued the oil cartel in the late 1990s. The vast majority of the OPEC members were cheating on their production quotas, which caused a major oversupply problem in the world oil market. Crude oil prices collapsed from $114 to $26 in less than three years (August 2013 through February 2016).
Crude oil prices have recovered fairly well during the past 18 months, as the global economy has shown signs of improvement. In fact, the market is currently trading at its highest level in over two years. Despite the recent advance, prices are not even close to the levels the market enjoyed just a few years ago. The current spot price for WTI crude oil is $57.17.
Where do we go from here? What’s the long-term outlook for crude oil as the global economy is slowly transitioning away from fossil fuels to alternative energy? Most energy experts agree that fossil fuels have seen their better days. However, the main disagreement between experts is length of the transition process.
Without question, the movement away from fossil fuels will not occur any time in the near future. This is an evolution that will play out over the course of the next 10 to 20 years. Therefore, crude oil will continue to play a vital role in the global economy at least for the next decade.
It certainly appears crude oil made an important bottom in February 2016 @ $26.05. Most likely, this marked the beginning of a new cyclical bull market. An average cyclical bull market will last 4 to 5 years. Based on this information, crude oil should continue to push its way higher for the remainder of this decade.
How high will the market climb during the next few years? Historical research suggests that many commodities will retrace 61% of their decline from the most recent bull market top. Crude oil formed an important top in 2013 @ $114. The cyclical low occurred in 2016 @ $26. Therefore, we can make an educated guess that the next peak will occur near the $80 level by 2020.
As we discussed a few moments ago, crude oil is most likely in a cyclical bull market which began in 2016. However, the long-term secular trend is bearish. Crude oil’s secular bear market began when it recorded its all-time high in July 2008. An average secular trend will last 20 to 25 years. Therefore, the dominant trend for the next several years is bearish. There will be several strong rallies along the way (similar to the current rally). However, it’s highly unlikely crude oil will ever exceed its 2008 peak @ $147.
Crude oil’s secular bear market trend matches up very well with the underlying transition process from fossil fuels to alternative energy. As the global economy slowly reduces its dependence on crude oil during the next two decades, the price will continue to drift lower, with a few cyclical bull market rallies along the way. Unfortunately, for the crude oil bulls, each cyclical rally will be unable to exceed the price level of the previous rally.
If the global economy actually makes a complete transition to a system based on alternative energy, crude oil will eventually drop below its 1986 secular bear market low of $9.75. Of course, this brutal price decline (if it occurs) will play out over the next 10 to 15 years. It certainly won’t happen any time in the near future.
How will this long-term bearish outlook affect the price of USO? Given the fact that crude oil is probably in the middle of a secular bear market, this means USO will be probably never exceed its 2008 high @ 119.17. However, that certainly doesn’t mean USO will drift relentlessly lower for the next several years. There will be several strong rallies along the way. In fact, USO is most likely in the early stages of a new cyclical bull market which began in February 2016. The ETF has a great deal of upside potential during the next few years. The next important
long-term resistance level is 42.30.
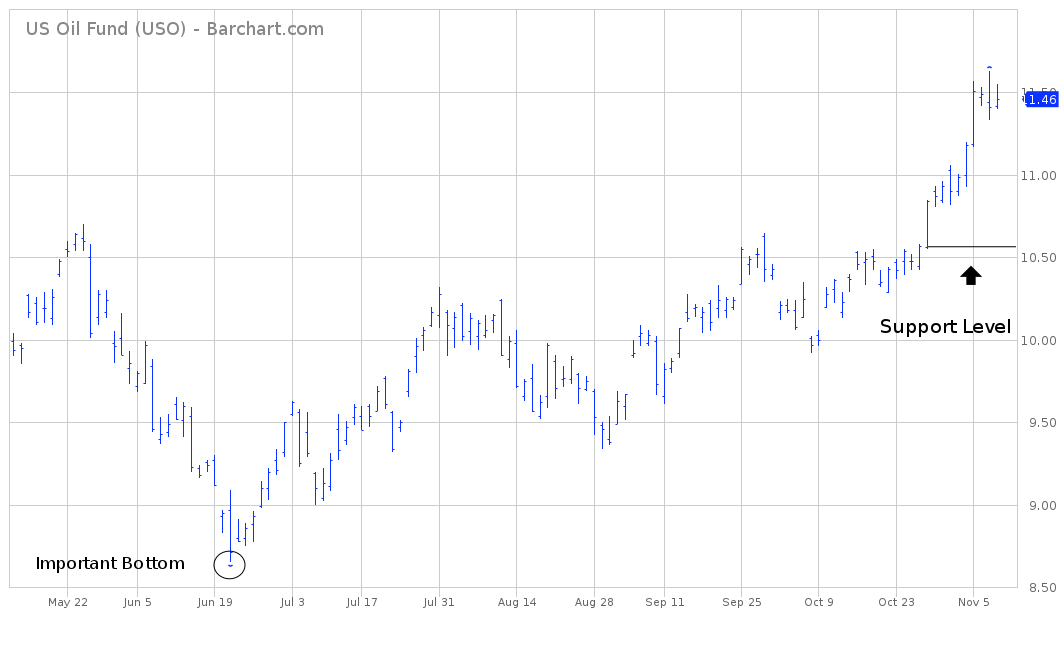
SHORT-TERM CHART – US Oil Fund USO
Please review the attached 6-month chart of USO. It certainly appears that an important bottom was recorded on June 21st. The bulls have recaptured the short-term momentum. The bears need a weekly close below 10.55 in order to push the ETF in their favor.

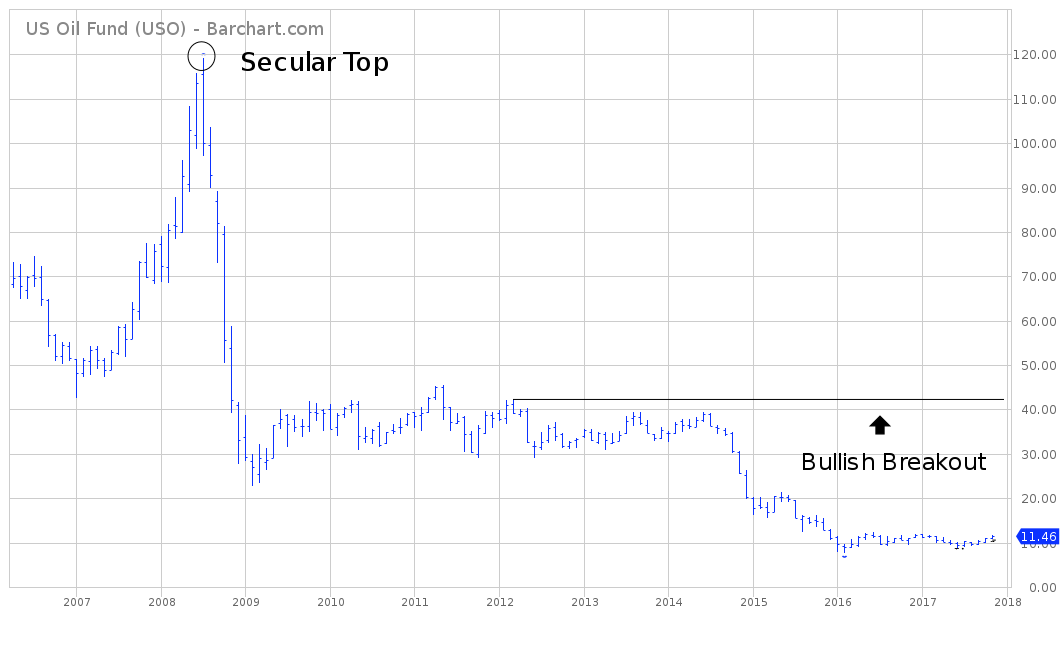
LONG-TERM CHART – US Oil Fund USO
Please review the attached 11-year chart of the USO. Most likely, USO formed a secular top in July 2008. It’s rather unlikely USO will ever exceed this level again based on the fact that crude oil is slowly losing its importance on the global energy stage. The next important resistance level is 42.30.