
S&P Bank SPDR ETF KBE
Key Statistics (as of 11/310/17
Thank you for reading this post, don't forget to subscribe!Daily High 48.40 Short-Term Trend Bullish
Daily Low 47.38 Intermediate-Term Trend Bullish
Daily Close 47.45 Long-Term Trend Bullish
Minor Support Level 43.15 Minor Resistance Level 48.62
Major Support Level 20.15 Major Resistance Level 58.89
Minor Buy Signal 49.40 Minor Sell Signal 42.44
Major Buy Signal 60.41 Major Sell Signal 18.34
BRIEF OVERVIEW SPDR ETF KBE
2018 will mark the ten year anniversary of the Great Financial Crisis of 2008. The financial crisis can be blamed on many factors. However, the majority of the blame has been laid at the feet of the banking industry. Specifically, banks were accused of aggressive lending practices, sloppy internal compliance, highly leveraged balance sheets as well as the formation of an array of worthless financial products which were sold to unsophisticated investors. The actions of the banks along with a nationwide real estate bubble created a perfect storm scenario which lead to a financial collapse on Wall Street and Main Street.
Where does the banking industry stand today, almost ten years after the financial crisis? Have the banks fully recovered from their near collapse? In a nutshell, the answer is, “Yes.” The entire banking sector is in much better financial shape today versus 2008.
Arguably, the largest contributing factor to the resurrection of the US banking system was the Dodd-Frank Act, which was signed into law by President Obama on July 21, 2010. This piece of legislation dramatically increased the transparency of financial derivatives, which many experts claim was the root cause of the Great Financial Crisis. Additionally, depository banks were forced to substantially reduce their involvement in proprietary trading, which included investment vehicles such as private equity and hedge funds.
Although Dodd-Frank was largely unpopular within the financial community, the law did ultimately achieve its main objective of stabilizing the banks and restoring consumer confidence.
These days, the US banking industry is certainly moving in the right direction with a strong tailwind in its favor. For the first time in a decade, banks are reaping the rewards of a restrictive monetary policy by the Federal Reserve. Generally speaking, banks become more profitable in a rising interest rate environment as they lend out money to their customers.
SPDR funds launched the S&P Banking Sector ETF in November 2005, using the ticker symbol KBE. This ETF is used as a barometer for tracking the overall health of our nation’s banking sector. KBE is quite diversified within the universe of the financial services industry. The ETF includes a diverse mixture of 71 different holdings. In addition to large money center banks, KBE also incorporates regional banks, asset management & custody banks, diversified banks and mortgage institutions.
SHORT-TERM VIEW
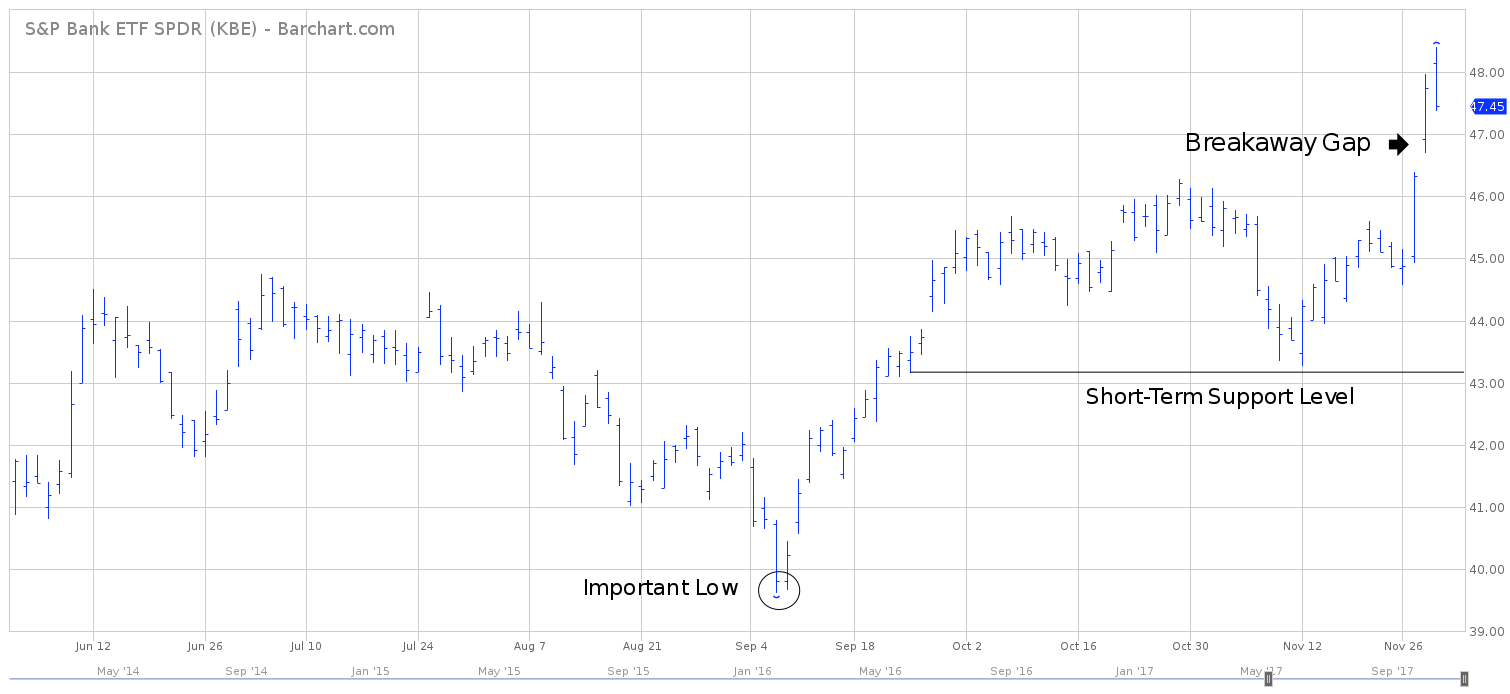
KBE has generated a substantial rally over the course of the past ten weeks. The ETF has increased 19.8% since forming an important bottom on September 7th. Obviously, the bulls are in complete control of the short-term trend. The next resistance level is 48.62. In order to reverse the bullish momentum, the bears need a weekly close below 43.15.
The recent burst of strength to the upside is largely the result of a slew of positive economic reports and Federal Reserve comments. The general consensus within the investment community appears to suggest that the Federal Reserve will maintain a restrictive monetary policy well into 2018. This is good news for the banking sector because banks are typically more profitable in a rising interest rate environment.
LONG-TERM VIEW
As we briefly discussed, the domestic banking industry has certainly improved from a financial standpoint following the crisis of 2008. Bank balance sheets have strengthened quite noticeably, particularly in regards to capital requirements. Will this trend continue or is the banking sector setting itself up for another collapse?
At least for now, it appears the rebound in the banking sector during the past few years is the “real deal.” Despite initial skepticism, the Dodd-Frank Act will go down in the history books as being a successful piece of legislation in terms of resurrecting the US banking system. Thanks to Dodd-Frank, banks were forced to shore up their balance sheets and increase their capital reserves. Today, banks have a much healthier capital structure, which will definitely come in handy during the next downturn in the US economy.
Based on long-term historical trends, history would suggest the US banking industry will remain quite vibrant and financially stable for the next several years. Why? Because financial events similar to 2008 occur rather infrequently, despite what the “doom & gloom” crowd would have us believe.
Let’s suppose for a moment that another crisis did indeed engulf the US economy within the next few years. It’s highly unlikely the culprit of the next financial crisis will be within the banking sector. The banks have their house in order, thanks to the 2008 crisis. Therefore, they will not be the “weak link” during the next meltdown. Lightning never strikes twice in the same place. The same thing can be said of global financial events. The next crisis will not involve the banks.
In comparison to other banking systems around the globe, the United States is in much better financial shape. For example, the majority of the large money center banks throughout Europe are definitely struggling. Although things have improved recently, it could easily take a few years of solid economic activity for Europe to recapitalize its banking system. Japan and India are also facing an uphill battle (although not as dramatic as Europe). Without question, the United States is the crown jewel of the global banking system. Most likely, this will not change any time in the near future.
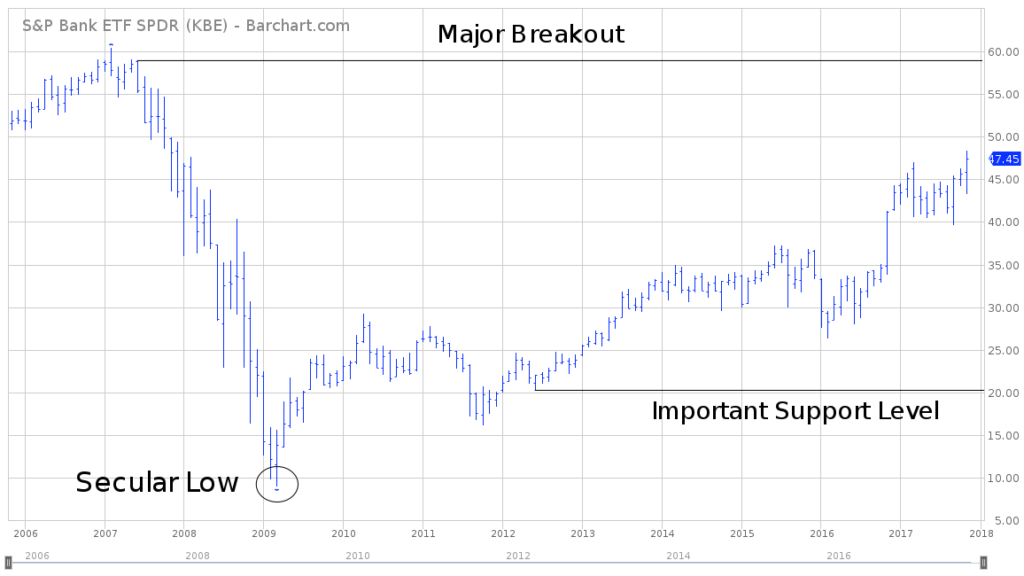
The long-term picture for KBE is quite bullish. March 2009 marked a secular low for KBE, as the financial crisis reached its maximum level of capitulation. The ETF has been pushing its way higher for the past 8 ½ years (with a few setbacks along the way).
The next important long-term resistance level is 58.89. In order to recapture the downside momentum from a long-term perspective, the bears need a weekly close below 20.15. Most likely, it would take a brutal recession within the financial industry to push KBE below 20.15. Therefore, the trend is clearly in favor of the bulls as far as the eye can see.
SHORT-TERM CHART
Please review the attached 6-month chart of KBE. The ETF has been on an absolute rip to the upside since forming a short-term bottom on September 7th. The bulls are in control of the short-term trend as long as KBE stays above 43.15.
LONG-TERM CHART
Please review the attached 12-year chart of KBE. A secular low was formed in March 2009 @ 8.90. As long as KBE stays above 20.15 on a weekly closing basis, the ETF is most likely in the middle stages of a secular bull market. A weekly close above 58.89 would suggest much higher prices for the next 3 to 5years.