

Guggenheim Solar ETF – TAN
Key Statistics
Thank you for reading this post, don't forget to subscribe!
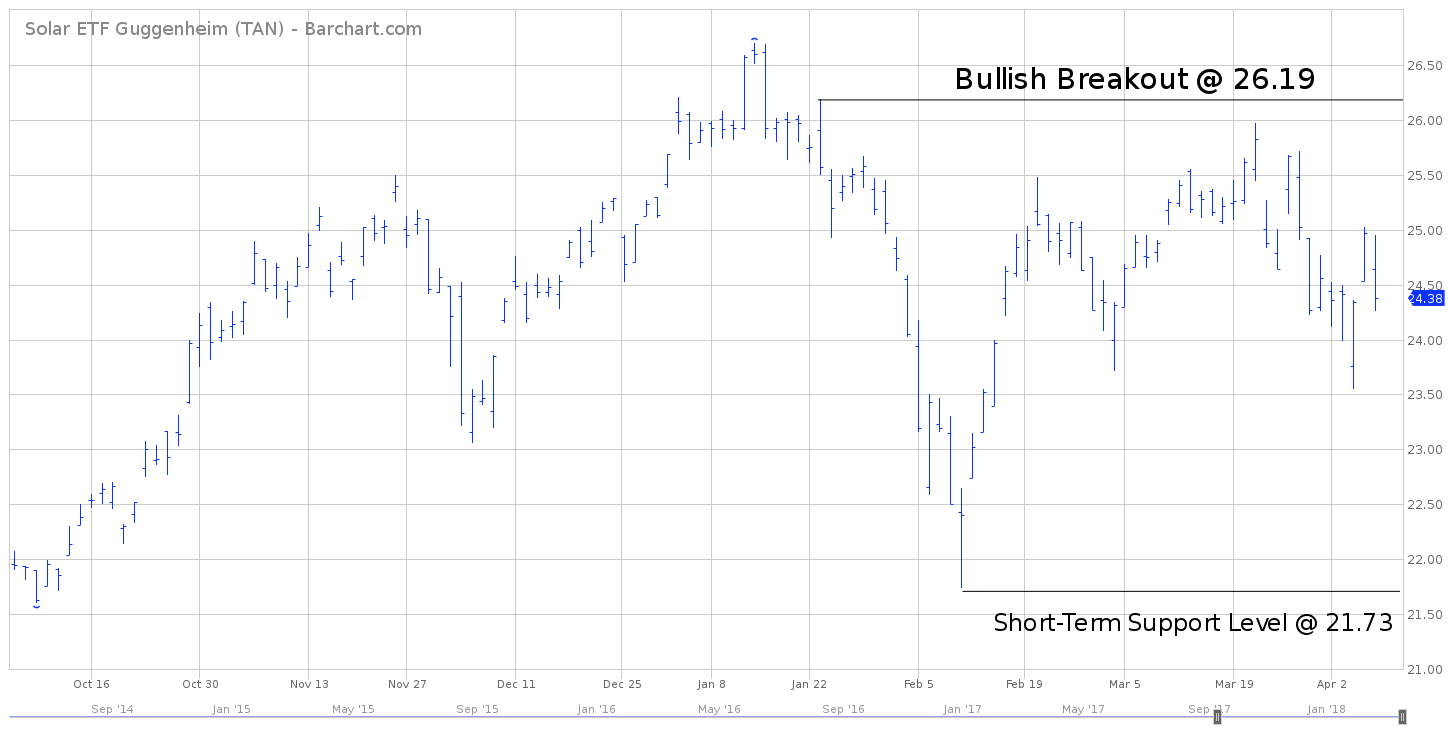
Minor Support Level 21.73 Minor Resistance Level 26.19
Major Support Level 15.00 Major Resistance Level 116.70
Minor Buy Signal 26.70 Minor Sell Signal 21.05
Major Buy Signal 138.40 Major Sell Signal 12.60
BRIEF OVERVIEW – SOLAR ETF TAN
During the past two decades, there has been a lingering debate within the scientific community concerning global warming and the negative effect it has on planet earth. What exactly is global warming and why should we be concerned? In layman’s terms, global warming is the observed rise in the average temperature of the earth’s climate system and its related effects on the environment.
Although scientists continue to argue about the true impact of global warming, most will agree that the climate system is warming. There has been a noticeable increase in the earth’s temperature since the 1950s. For example, 16 of the 17 warmest years on record have occurred since 2000. If the rate of change continues, the global surface temperature could increase from a range of 0.5° F to 8.6° F during the 21st century.
The root cause of the increase in global surface temperatures is blamed on the dramatic rise of greenhouse gases in the atmosphere. What are greenhouse gases? This would include water vapor, methane and carbon dioxide. Many people believe greenhouse gases are detrimental to the environment. In reality, greenhouse gases are quite beneficial to our planet. Without greenhouse gases, the average temperature of the earth’s surface would be 0° F. Basically, earth would be uninhabitable without greenhouse gases.
The rise in greenhouse gases can be traced all the way back to the Industrial Revolution in the 1750s, particularly carbon dioxide. More specifically, there has been a 40% increase in the atmospheric concentration of carbon dioxide since the beginning of the Industrial Revolution. This is known as the “greenhouse effect,” which is the main culprit of global warming.
Many scientists conclude that global warming can be reduced to a manageable level by reducing the level of carbon dioxide in the atmosphere. This can be accomplished by reducing our dependence on fossil fuels. This includes petroleum, coal and natural gas.
The burning of fossil fuels has produced approximately 75% of the increase of carbon dioxide from human activity during the past 20 years. This explains why environmentalists, think tank groups and many in the scientific community are in favor of reducing our nation’s dependence on petroleum based products, to be replaced by alternative forms of energy. Specifically, this would involve replacing crude oil, gasoline and natural gas with wind, geothermal, hydroelectric and solar power as new sources of energy.
The Guggenheim family of exchange traded funds introduced the Solar ETF on April 15, 2008. The ticker symbol is TAN. The ETF invests in companies within several different segments of the solar power industry. These segments include solar power equipment producers, companies involved in solar power system installation and companies that specialize in selling electricity derived from solar power. TAN has 29 different holdings. Approximately 44% of the holdings are comprised of companies located outside of the United States.
SHORT-TERM VIEW – Solar ETF TAN
TAN has been trading sideways for the past six months. Currently, the short-term momentum is in favor of the bears. The next level of support is 21.73. The bulls need a weekly close above 26.19 in order to reverse the momentum. The most likely scenario is a continuation of the trading range between 21.63 and 26.70.
LONG-TERM VIEW – Solar ETF TAN
The idea of substituting petroleum energy with alternative energy has been around for decades. However, it entered mainstream America during the Carter administration in the 1970s, when President Carter advocated coal gasification as an alternative to expensive imported oil. This program never gained much traction. In fact, the entire program was completely scrapped in the early 1980s, as oil prices began to fall.
Throughout the 1980s & 1990s, there was very little discussion concerning alternative energy. Why? Because petroleum based products remained incredibly cheap. As a result, there was simply no desire on the part of lawmakers and energy experts to make any radical changes.
In the early 2000s, the momentum began to shift in favor of those advocating alternative energy. Crude oil was in the early stages of a new cyclical bull market. During the first five years of the new decade (2000 thru 2005), the price increased 146%. This huge price increase was enough to capture the attention of the alternative energy crowd.
The general public got on board the alternative energy bandwagon beginning in 2006, with the release of Al Gore’s documentary, An Inconvenient Truth. The documentary argued that petroleum based energy was the root cause of global warming. Within 12 months following the release of the documentary, the price of crude oil surged to an all-time high. The price continued to climb until it reached its peak in July 2008, @ $147 per barrel.
The sharp rise in fuel prices coupled with Al Gore’s documentary dramatically increased the popularity of alternative energy. In 2007 & 2008, a huge wave of companies began to enter the alternative energy arena, particularly solar energy. However, the enthusiasm quickly came to a grinding halt in 2008, as the global financial crisis disrupted the availability of investment capital. Additionally, crude oil prices plummeted from $147 per barrel to $32 per barrel in less than six months.
For the past decade, the alternative energy industry has languished in terms of investor demand and enthusiasm among the general public. This lack of investor demand and public involvement is mainly due to the fact that energy prices have been relatively stable during the past few years. For example, crude oil prices have been locked in a boring trading range between $40 and $70 per barrel. As long as fuel prices remain calm, there is very little chance that alternative energy will garner enough support from lawmakers and investors to return to its level of popularity from the mid-2000s.
Of course, many energy experts will argue that investing in alternative energy is a complete waste of time and money. Without government subsidies, they claim that “green energy” (i.e. wind, solar, geothermal and hydroelectric) is not economically feasible. These experts point to the fact that several hundred billion dollars have been spent on transitioning from petroleum energy to alternative energy during the past few decades. However, alternative energy has not even made a dent in global energy consumption. In fact, after 30 years of government subsidies, wind power and solar power contribute less than 1% of the earth’s total energy output.
The debate rages on between the green energy crowd and those who prefer the traditional form of petroleum energy. At the end of the day, the most likely outcome will be some type of blended energy solution which involves wind, solar, hydroelectric and petroleum based products.
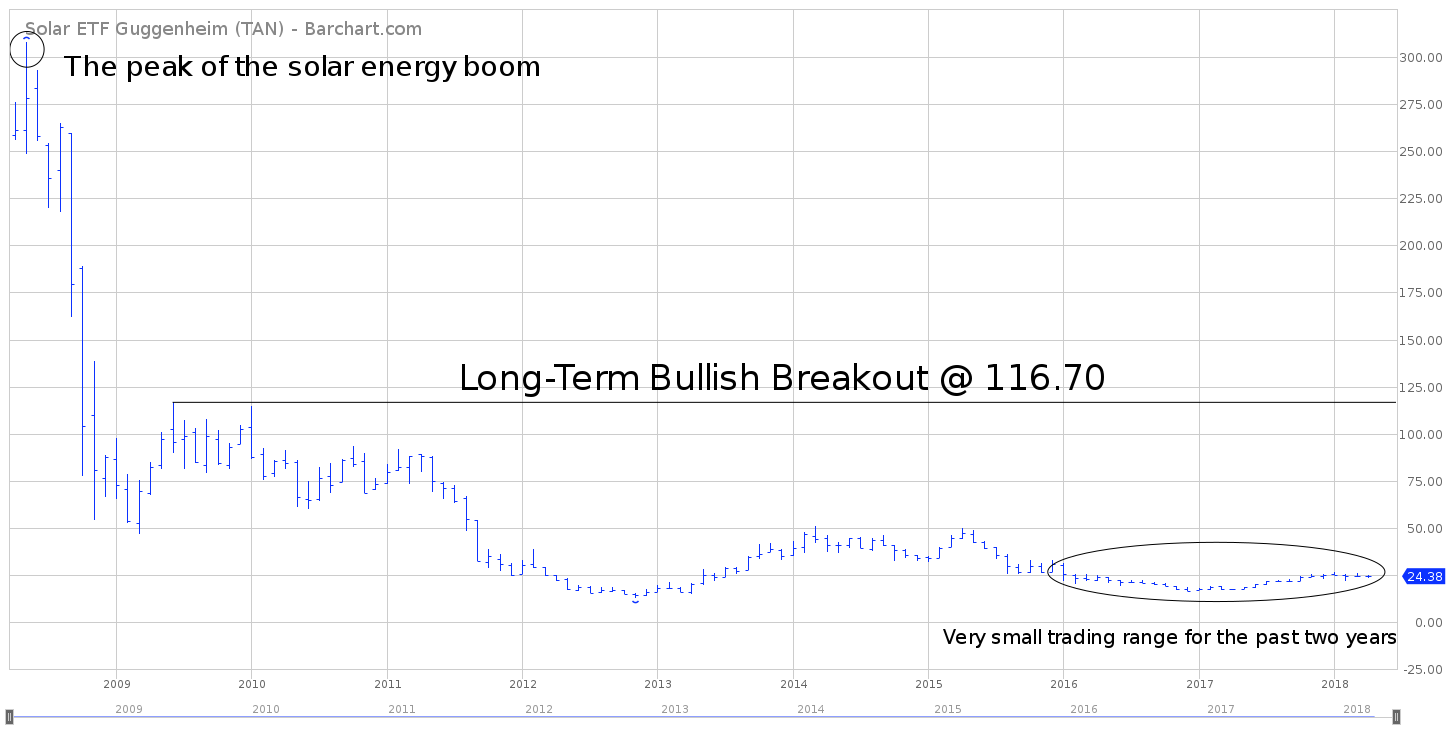
The long-term momentum of TAN is definitely in favor of the bears. In fact, the bears have been in control of TAN throughout most of its entire trading history, dating back to 2008. The next level of support is 15.00. The bulls need a weekly close above 116.70 to push the ETF in their favor, which is highly unlikely any time in the near future.
SHORT-TERM CHART – Solar ETF TAN
Please review the 6-month chart of TAN. The short-term chart pattern is bearish. The next level of support is 21.73. The bulls need a close above 26.19 in order to turn the chart pattern in their favor.
LONG-TERM CHART – Solar ETF TAN
Please review the 10-year chart of TAN. This chart contains the entire trading history of TAN. April 15th will mark ten years of trading history for this ETF. Unfortunately, Guggenheim introduced TAN about five months prior to the beginning of the 2008 financial crisis. This also marked the peak of investor enthusiasm for solar energy. The ETF has never recovered from its brutal decline in 2008.
For the past two years, TAN has been locked in an incredibly tight trading range. This is an indication that there has been very little investor interest in solar energy over the course of the past few years. The most likely scenario is a continuation of the trading range. The bullish breakout occurs @ 116.70.

