
iShares 20-Year Treasury Bond ETF (TLT)
Key Statistics
Minor Support Level 115.88 Minor Resistance Level 127.12
Major Support Level 101.69 Major Resistance Level 143.62
Minor Buy Signal 128.59 Minor Sell Signal 114.36
Major Buy Signal 146.73 Major Sell Signal 97.35
BRIEF OVERVIEW – TLT Exchange Traded Fund
Lately, there has been a great deal of chatter emanating from the Wall Street community concerning the health of our nation’s economy. And for good reason. Without question, the vast majority of economic reports released by governmental agencies during the past few months have been slowly deteriorating. Please review the following table.
Major Economic Reports
Report Current Number Previous Number Trend
Retail Sales $505.9 billion $506.9 billion Trending lower
Job Creation 20K 311K Trending lower
Chicago PMI 58.7 54.7 Trending lower
New Home Sales 667K 636K Trending higher
Durable Goods (1.6%) 0.9% Trending lower
GDP 2.2% 3.4% Trending lower
Source Federal Reserve Board of St Louis
As you can see from the table, based on economic data collected by the federal government (and compiled by the St Louis Fed), the US economy does appear to be rolling over. In fact, this is the first sign of real weakness since the Fall of 2015. Is the United States on the verge of a recession? Will the United States experience back-to-back quarters of negative growth for the first time since Q2 2009? Of course, it’s impossible to answer that question with 100% accuracy. However, the best place to start is by examining the level of domestic interest rates.
From a historical perspective, the nominal level of interest rates has been the most reliable and accurate indicator in forecasting future economic activity. This includes short-term rates as well as long-term rates. In terms of the interest rate product, federally insured products provide the most reliable and accurate data. This would consist of products such as US Treasury Bonds, Treasury Notes and Treasury Bills. Government products are preferred over corporate bonds or debt instruments issued by municipalities and other local taxing authorities.
Interest rate products issued by the United States federal government are considered risk-free investments. This explains why they are the best forecasting tool for determining future economic activity. The same also holds true for investors who are trying to forecast economic growth in other countries. It’s always best to start with interest rate products issued at the federal level.
The iShares family of exchange traded funds (managed by BlackRock) introduced the 20-Year Treasury Bond ETF, with the objective of allowing investors the opportunity to participate in the future direction of long-term interest rates. The ETF was launched on July 22, 2002, using the ticker symbol TLT. The ETF consists entirely of United States Treasury Bonds with a maturity of greater than 20 years. Therefore, TLT is a “pure play” on long-term interest rates. In fact, TLT is the most popular interest rate ETF in terms of daily volume.
SHORT-TERM VIEW – TLT Exchange Traded Fund
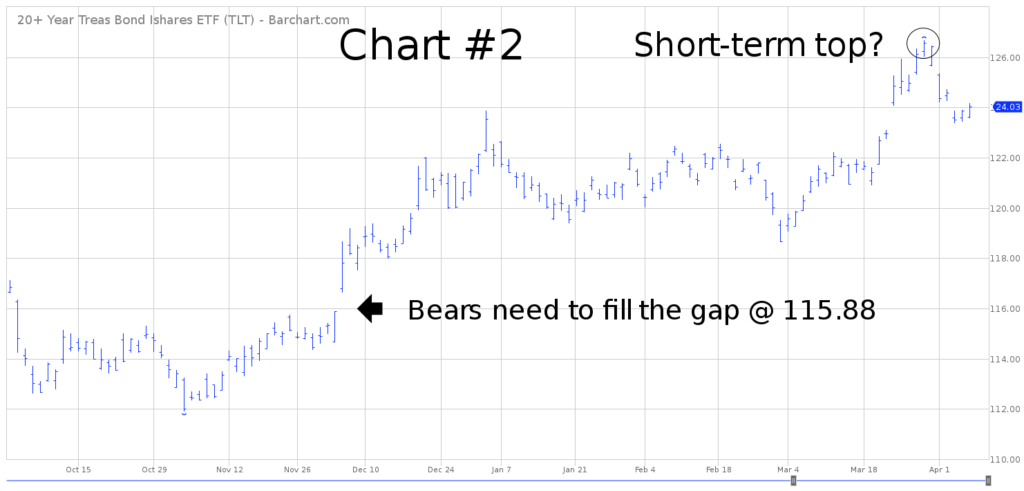
TLT has enjoyed a sharp advance over the course of the past five months. In terms of the short-term momentum, the bulls certainly have the upper hand. The next resistance level is 127.12. In order to reverse the momentum, the bears need to generate a weekly close below 115.88. At least for now, the most likely scenario is a continuation of higher prices.
LONG-TERM VIEW – TLT Exchange Traded Fund
As we briefly discussed, interest rates on government bonds are typically the most accurate indicator for determining the future direction of the macro economy. Why? Because interest rates are used to determine the “cost” of money. For example, if the US economy is showing signs of strength, many businesses will expand their operation in order to take advantage of the growing economy.
Expanding a business requires building new plants and equipment. Obviously, this is an expensive undertaking which probably requires a loan from a bank. An increase in bank loans will put upward pressure on interest rates, thereby forcing the “cost” of money to rise. The raising of interest rates usually occurs simultaneously across the board among all financial products. Most often, it begins when the Federal Reserve raises its key lending rate. This is quickly followed by banks and other financial institutions. Almost immediately, rates on financial products like government bonds and corporate bonds will increase. This explains why government bonds are a great way to gauge the health of the economy.
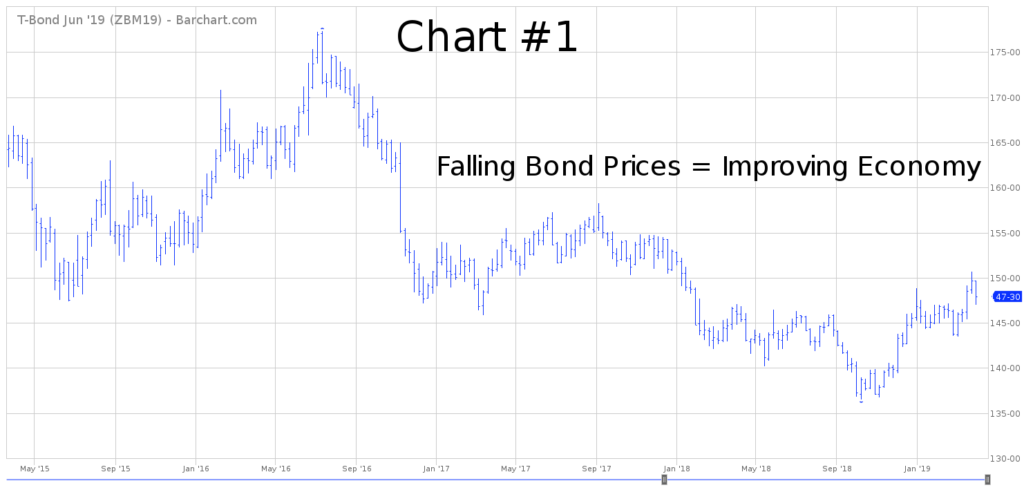
In order to determine the current state of the domestic economy, let’s examine a price chart of US Treasury Bonds (Chart #1). Specifically, this chart displays the price of a government bond with a maturity of 30 years. Price data is included from 2015 through the present.
Please Note: For those of you who may not be familiar with the bond market, always remember that bond prices have an inverse relationship to interest rates. Rising bond prices are analogous to declining interest rates. Conversely, when bond prices are falling, interest rates are rising.
As you can clearly see from the chart, bond prices have been falling during the past three years. Therefore, interest rates have been rising. Why have rates been rising? Because businesses and consumers have increased their demand for money in order to take advantage of an improving global economy.
Please examine the price activity during the past five months. Without question, bond prices have been slowly grinding their way higher, which means interest rates have been declining. In fact, the recent drop in rates corresponds perfectly with the weak economic reports of the past two months.
Although government bond prices have risen during the past few months and a handful of the economic reports have turned soft, this hardly qualifies as the beginning of a major economic slowdown (either domestically or internationally). In fact, the most recent employment report from the Bureau of Labor Statistics released on 5 April, confirmed the creation of 196K jobs during the month of March, well above the consensus forecast of 180K. This is a sign of a healthy domestic economy.
Currently, the United States is enjoying one of its longest periods of economic expansion in history. Officially, the last recession in the US ended in June 2009. In 2019, our nation is entering its tenth consecutive year of economic prosperity. Despite the recent blip in bond prices, the US economy remains in decent shape.
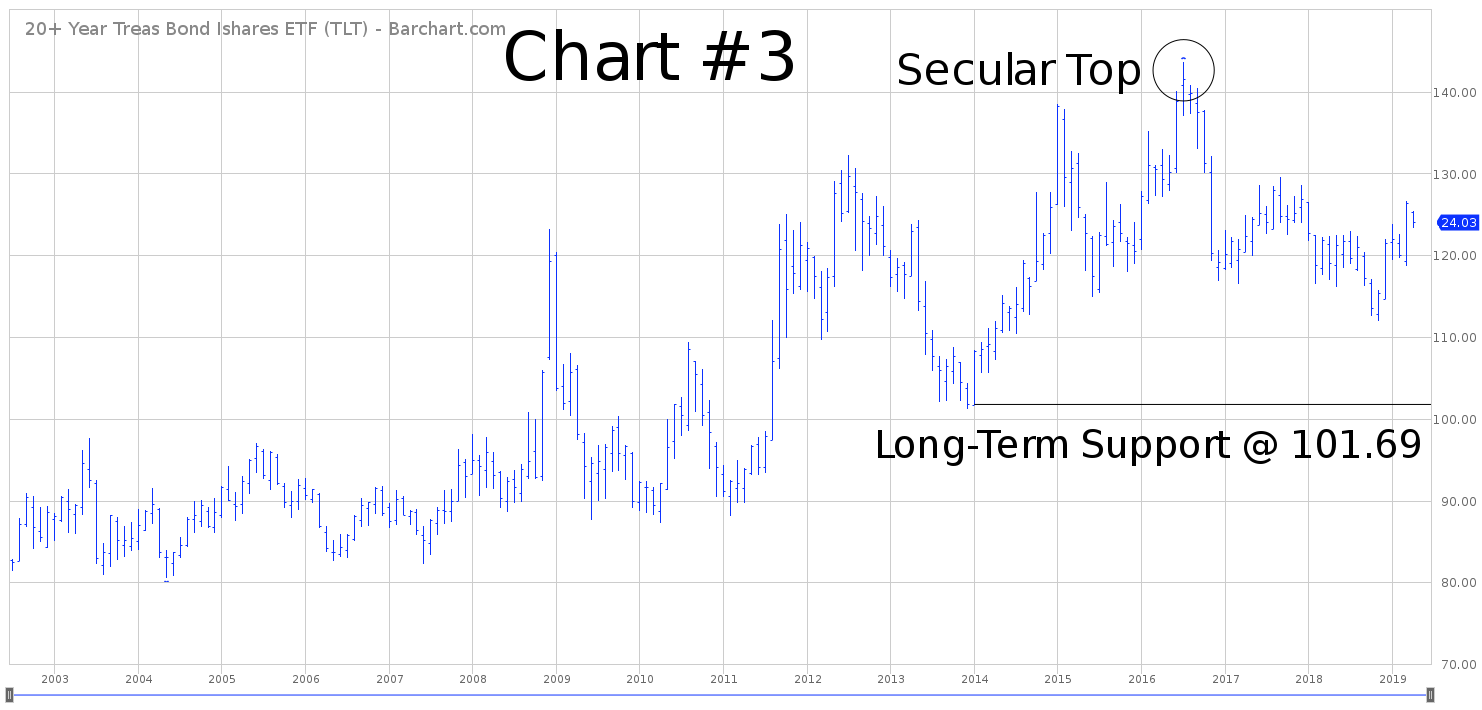
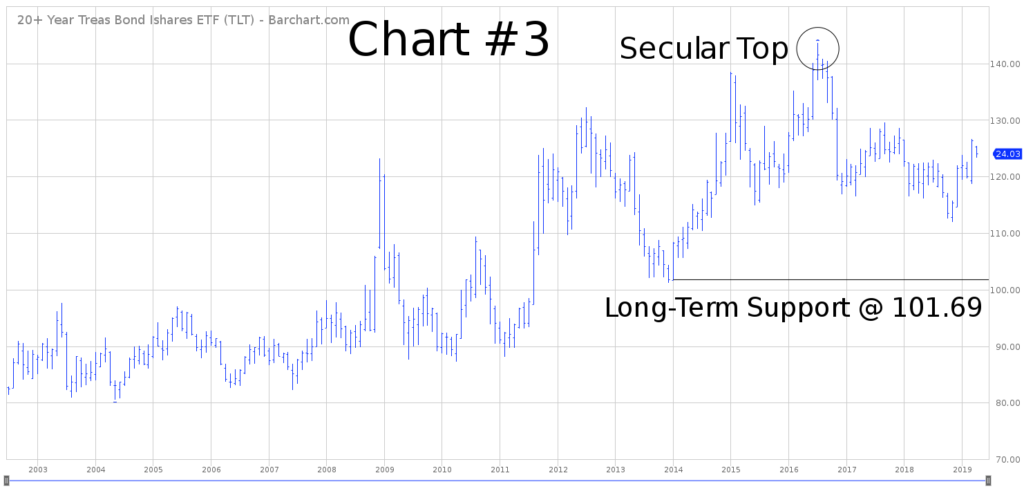
In terms of TLT, the bulls are in control of the long-term momentum. The next level of resistance is 143.62. In order to reverse the momentum, the bears need a weekly close below 101.69. A strong argument could be made that TLT recorded an important top @ 143.62 in July 2016.
SHORT-TERM CHART – TLT Exchange Traded Fund
Please review the 6-month chart of TLT (Chart #2). Currently, the short-term trend is in favor of the bulls. The next resistance level is 127.12. In order to reverse the bullish chart pattern, the bears need a weekly close below 115.88. At least for now, the most likely scenario is a continuation of higher prices. However, it does appear that a short-term top may have been formed on 28 March @ 126.69.
LONG-TERM CHART – TLT Exchange Traded Fund
Please review the 17-year chart of TLT (Chart #3). This chart covers the entire trading history of the ETF. BlackRock picked a perfect time to launch TLT. The US economy was recovering from the internet mania and the rate of inflation was historically low. Consequently, TLT had the “wind at its back” for several years, as prices moved relentlessly higher.
The long-term chart pattern still remains bullish. However, it does appear that a secular top was formed in July 2016 @ 143.62. Going forward, the main culprit for the bond market will be inflation. Commodity cycles are forecasting a nasty bout of global food inflation beginning in 2020. Consequently, TLT could easily drift lower for the next decade. The important number to watch is 101.69.


