


We Distill the Investment Universe to Just 154 ETF Investment Options
We have carefully selected 154 ETFs to represent the entire investment universe. Investors that try to follow all market news and trends on thousands of companies daily are setting unrealistic investment expectations. Why we chose this process:
-
Instant diversification – investing with Exchange Traded Funds (ETFs) buys an entire basket of stocks within a sector or industry
Low cost – we have selected ETFs with some of the lowest expense ratios in the industry
Asset class determines performance – studies have shown selecting the right asset class is what generates the majority of stock returns, not the individual stock pick
Eliminate duplication – buying multiple highly correlated investments will not help your investment performance
Profit in bear markets – ETFs offer alternative categories that increase in value when stock markets are crashing
We Compute 54 Different Trend Analytics Weekly on Each ETF
We harness the power of data analytics and raw computing power to crunch millions of computations each week to generate trend rankings of 154 ETFs that we think are a holistic representation of most stock market investment options. Key to our trend analysis is:
-
Absolute Trend Strength – this measures the individual trend data on a specific ETF to determine the strength, velocity and direction of its trend
Relative Trend Strength – this measures the ETF trend strength in relation to the broad stock market trend to determine if the individual ETF trend direction, strength and velocity is greater than, or less than the market average.
Power Score – this is the overall measure of combined absolute and relative trend and momentum strength for an ETF.
Edge Score – this measures weekly change in Power score rankings so you can see if ETF trend strength is rising or falling.
Alike Score – this measures how correlated the ETF trend is to the broad stock market trend. A well diversified portfolio will have ETFs with a range of Alike Scores.
We Stack and Rank ETF Trend Performance Weekly into Quintiles
We use quintiles to simplify analysis and “chunk” the performance list into 5 equal segments. The 1st Quintile represents the top 20%, and each subsequent quintile represents the next 20% of performance results. We color-code the quintiles for easy reference. What you need to know about the quintile ranking process:
-
Green Zones – the top 2 quintiles are shaded two tones of green and represent ETF sectors and asset classes that are outperforming the market. This is where you want to be investing.
Yellow Zone – the 3rd quintile is the market average group and is performing about the same as the stock market index.
Red Zones – the bottom 2 quintiles are shaded two tones of red and represent ETF sectors that are under performing the market index. You want to avoid these sectors.
Easy to follow – “at-a-glance” you instantly know what sectors to invest in and what sectors to avoid with our simple color-coded trend rankings.
Long term focus – the data points we compute focus on the long-term, you only need to review every few weeks or month to stay on top of everything.
Our Asset Class Heat map Ranks Sub-Asset Categories by Trend Strength
We have divided our investment universe of 154 ETFs into 9 major asset categories, with each category ranked in descending order of trend strength to help you create a well diversified portfolio of non-correlated asset leaders. This data view helps:
-
 Limit correlation risk – viewing market leaders across each asset class helps reduce correlation risk and build a more diversified portfolio
Strategic asset allocation – with fixed allocation targets for various asset classes it is easy to re-balance portfolios into new leaders within the same asset class
Tactical asset allocation – having the flexibility to deviate from fixed allocations allows the opportunity to take advantage of short-term market opportunities
Dynamic asset allocation – having a broad allocation strategy allows for capitalization on extreme market opportunities and leadership concentration
Portfolio re-balancing – viewing market leaders by asset class allows for easy upgrading while still remaining within the same asset category
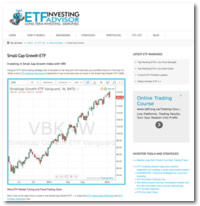
Real-Time ETF Charts and Quotes including 3rd Party Analyst Research Opinions
See the long term trend perspective with our real-time charts built from weekly data points and also keep in touch with the latest ETF price movements in one view. In addition you also get:
-
Social media analyst articles – stay current with the latest 3rd party investment thesis on each asset class ETF
Visualize long-term trends – constructing charts using full week data points takes the daily noise out of the picture and helps to see longer term trends
Real-time price quotes – when your ready to trade you can check the real-time price quote any any of the 154 ETFs
Technical analysis – ability to overlay more than 60 technical analysis indicators to your chart analysis
Comparison overlays – overlay any other chart to visually compare the trend of asset classes to other ETFs or stock indexes
The Tools and Data You Need to Create Winning Long Term Portfolios
The goal of our framework was to provide tools and data is an easy to understand format that long term investors need to construct and maintain winning portfolios. The heart of the framework is our weekly tables which also include:
-
 Long Trend Score – this is the measure of the absolute trend strength and direction of a specific asset category ETF which is also color-coded into the 5 trend strength quintiles for easy identification of trend direction
Short Trend Score – this is a measure of the absolute short term trend strength and direction taking a view of the trend dynamics over the recent 12 week period
52 Week High(%) – this is an absolute trend leadership indicator which measures how close a specific asset category ETF is within its own 52 week high
Trend Weeks – this is a trend duration measure of how many weeks a specific ETF has been in a confirmed long term trend phase
Volatility Stop Loss – this is a special stop loss level calculated based on ETF volatility levels. It automatically calculates tighter stop loss levels during periods of low volatility and expands during higher periods of volatility to prevent premature exits, but is capped at a maximum drawdown of 10%
What You Also Get With Your Membership
We believe everyone can succeed at investing with the right strategy and become their own ETF Investment Advisor. Our goal is to provide you with trend data and a simple framework to empower long term investing success. In addition to everything above you also get:
-
Weekly Updating – keep on top of market trends and changes is sector leadership as they develop
Sortable tables – sort the 154 ETF universe by 10 powerful scoring criteria to fine-tune your investment strategy
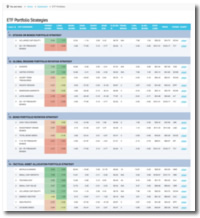
15+ powerful strategies – a full range of popular and unique investment strategies to utilize in conjunction with the weekly trend ranking tables
6 Custom ETF Portfolios – a range of asset class investment options grouped into popular portfolios with weekly ranking updates
Peace of Mind – you have the tools and a long-term strategy to create your secure financial future
