PowerShares DB Agriculture Fund DBA ETF
Key Statistics
Thank you for reading this post, don't forget to subscribe!Minor Support Level 18.33 Minor Resistance Level 19.51
Major Support Level 17.66 Major Resistance Level 38.16
Minor Buy Signal 19.60 Minor Sell Signal 18.18
Major Buy Signal 42.16 Major Sell Signal 16.66
BRIEF OVERVIEW – DBA ETF
The rate of inflation in the United States (as measured by the Consumer Price Index) has been practically non-existent during the past decade. In fact, inflation has been on a downward trajectory since 1982. Please review the following table.
US Inflation Rate
Date Inflation Rate Date Inflation Rate
1980 13.5% 1999 2.2%
1981 10.3% 2000 3.4%
1982 6.2% 2001 2.8%
1983 3.2% 2002 1.6%
1984 4.3% 2003 2.3%
1985 3.6% 2004 2.7%
1986 1.9% 2005 3.4%
1987 3.6% 2006 3.2%
1988 4.1% 2007 2.8%
1989 4.8% 2008 3.8%
1990 5.4% 2009 0.4% (-)
1991 4.2% 2010 1.6%
1992 3.0% 2011 3.2%
1993 3.0% 2012 2.1%
1994 2.6% 2013 1.5%
1995 2.8% 2014 1.6%
1996 3.0% 2015 0.1%
1997 2.3% 2016 1.3%
1998 1.6% 2017 2.1%
As you can see from the table, American consumers have enjoyed low levels of inflation for the past four decades. One of the contributing factors to this low inflation rate is the stable level of food prices, particularly grain prices.
Arguably, farmers serve the most important function in the global economy. They provide food for the world. And they perform this task in an incredibly efficient manner. In fact, in comparison to other major producers of goods and services, farmers are regarded as the most efficient.
Of course, many consumers will argue that food prices have increased sharply since the 1980s. Their weekly trip to the grocery store is much more expensive today versus 30 years ago. This is correct. Food prices have risen dramatically. However, the overwhelming majority of this increase can’t be blamed on the farmer.
Unfortunately, food doesn’t magically appear in your local grocery store directly from a farmer’s corn crop in Iowa. There are several layers between the consumer and the farmer. This would include such things as transportation, marketing, packaging, advertising, storage and distribution. Each added step along the way increases the price of the food. This explains why food prices continue to rise. It has very little to do with the farmer. In fact, agriculture prices have remained incredibly stable during the past 20 years. Please review the following table.
Agriculture Prices
Commodity 1997 2007 2017 % Change
Cocoa 1630 2035 1892 0.8%
Coffee 1.62 1.36 1.26 (1.1%)
Corn 2.65 4.55 3.50 1.6%
Milk 12.58 18.88 15.40 1.1%
Orange Juice 0.80 1.43 1.36 3.5%
Soybeans 6.70 11.99 9.51 2.1%
Sugar 12.22 10.82 15.16 1.2%
Wheat 3.25 8.85 4.27 1.6%
As the table clearly indicates, agriculture prices have remained practically dormant over the course of the past 20 years. The average annual price increase during the past two decades has been a meager 1.3%. If we examine the past ten years, prices have actually declined! This chart proves that farmers can’t be blamed for the rise in food prices.
The last big surge in inflation occurred from 1974 through 1981. During that period of time, the average annual inflation rate was 9.4%. A large contributing factor to the high level of inflation was a dramatic increase in food prices. The North American corn belt experienced two growing seasons of brutal weather conditions along with the Russian grain embargo. This explains the rise in food & ag prices during this stretch if time.
With the exception of 1988 and 2012, farming conditions have been very favorable during the past 20 to 30 years. Of course, this means food prices have remained steady. How much longer can this “winning streak” of stable food prices continue? Probably not much longer.
The PowerShares family of exchange traded funds introduced the DB Agriculture Fund on January 5, 2007, using the ticker symbol DBA. This ETF is a pure play on food and agriculture prices. DBA does not hold any equity positions. Instead, the fund is composed entirely of food and grain futures contracts. Specifically, DBA is invested in ten different commodities. The top five commodities include wheat, soybeans, corn, live cattle and sugar. Essentially, investors are placing a speculative wager on an increase in commodity prices.
SHORT-TERM VIEW – DBA ETF
Thanks to an impressive rally during the past six weeks, the bulls are in control of the
short-term momentum. During the past 12 months, DBA has spent the majority of its time drifting lower, with a few feeble rally attempts along the way. Therefore, the current advance could be rather short lived. A weekly close above 19.51 would certainly increase the bullish momentum.
The bears need a weekly close below 18.33 to reclaim the selling pressure. Based on the price action over the course of the past several months, the most likely scenario is a continuation of lower prices. However, at least for now, the bulls have the upper hand.
LONG-TERM VIEW – DBA ETF
As we briefly discussed, food & agriculture prices have been stagnant for the past 20 years. Prices have remained calm for the past several years for two main reasons. The first reason is because farmers are incredibly efficient at producing food for the global population. The agriculture industry has generated tremendous economies of scale during the past two decades as more bushels of grain have been produced on a larger scale with fewer input costs.
Secondly, North American farmers have enjoyed several years of near perfect growing conditions. As a result, the global supply of grain and food commodities are near an all-time high.
Historically, farming has been a very cyclical industry. These cycles can be traced back to the 1800s. One of the main contributing factors to farm cycles is the weather. Although it’s impossible to accurately forecast the weather, there are fairly predictable long-term weather patterns which have remained consistent during the past several decades. These patterns suggest that the mild weather conditions over the past 30 years throughout the corn belt could be coming to an end. If the weather does indeed become unstable during the next several years, consumers could be facing a dramatic surge in food prices (very similar to the late 1970s and early 1980s). Food inflation could force the overall inflation rate to much higher levels as we enter a new decade in less than two years.
It’s not surprising that the long-term view of DBA is quite bearish, as food & ag prices have drifted sideways-to-lower for the past several years. In fact, DBA made an all-time historic low on December 12, 2017, @ 18.18. It doesn’t get more bearish than that.
As a general rule of thumb, it’s never a good idea to pick tops and bottoms. This is definitely not a successful trading strategy. However, for those who occasionally attempt to pick a bottom in a stock or ETF, DBA could turn out to be the contrarian play of the year.
It certainly appears agriculture prices could be in the process of forming a multi-year low. If this is true, DBA has the potential to generate a sustainable rally.
The long-term view will remain bearish as long as DBA stays below 38.16. It would take much higher food & ag prices to push the ETF above 38.16. At least for the next several weeks (and probably much longer), the bears are in control of the long-term momentum.
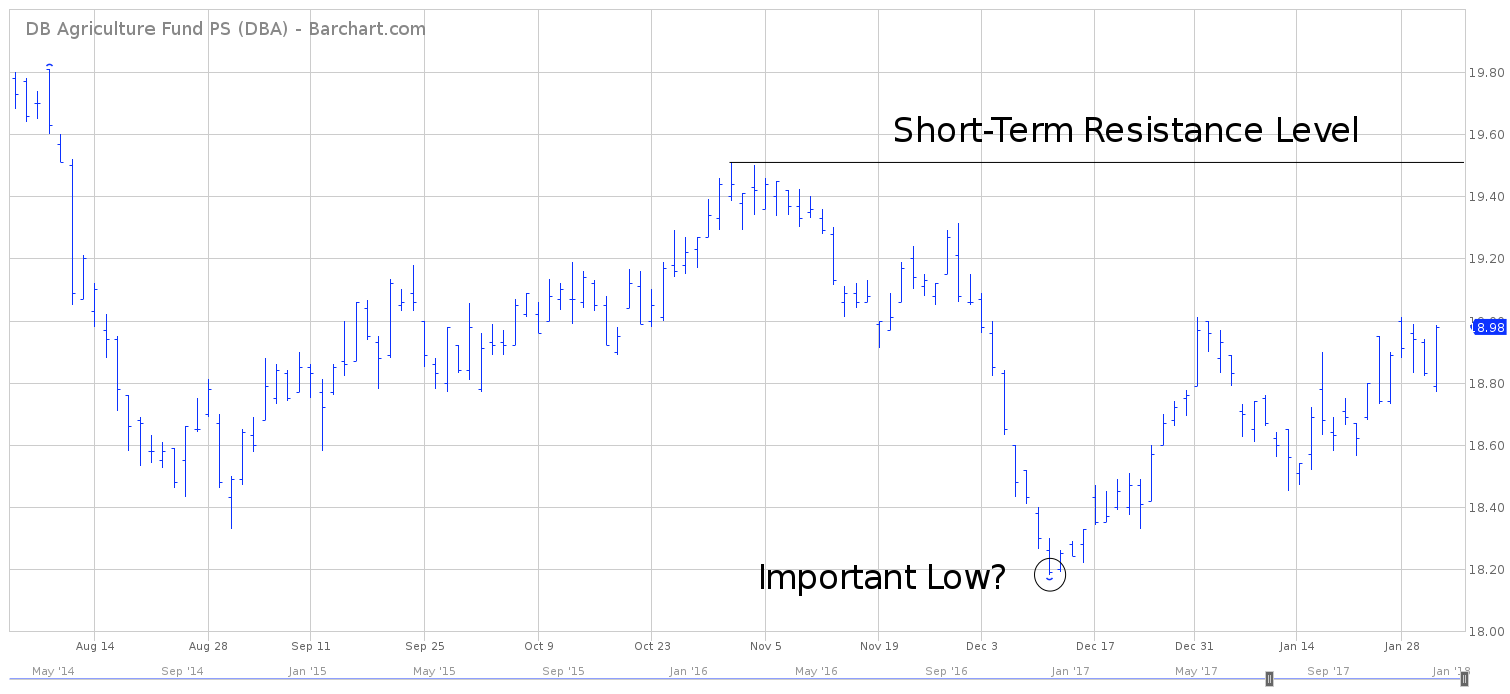
SHORT-TERM CHART – DBA ETF
Please review the attached 6-month chart of DBA. The short-term trend will remain bearish as long as the ETF stays below 19.51. Did the December low @ 18.18 mark an important bottom? The jury’s still out. It’s much too early to know for sure. At the very least, DBA must produce a weekly close above 19.51.

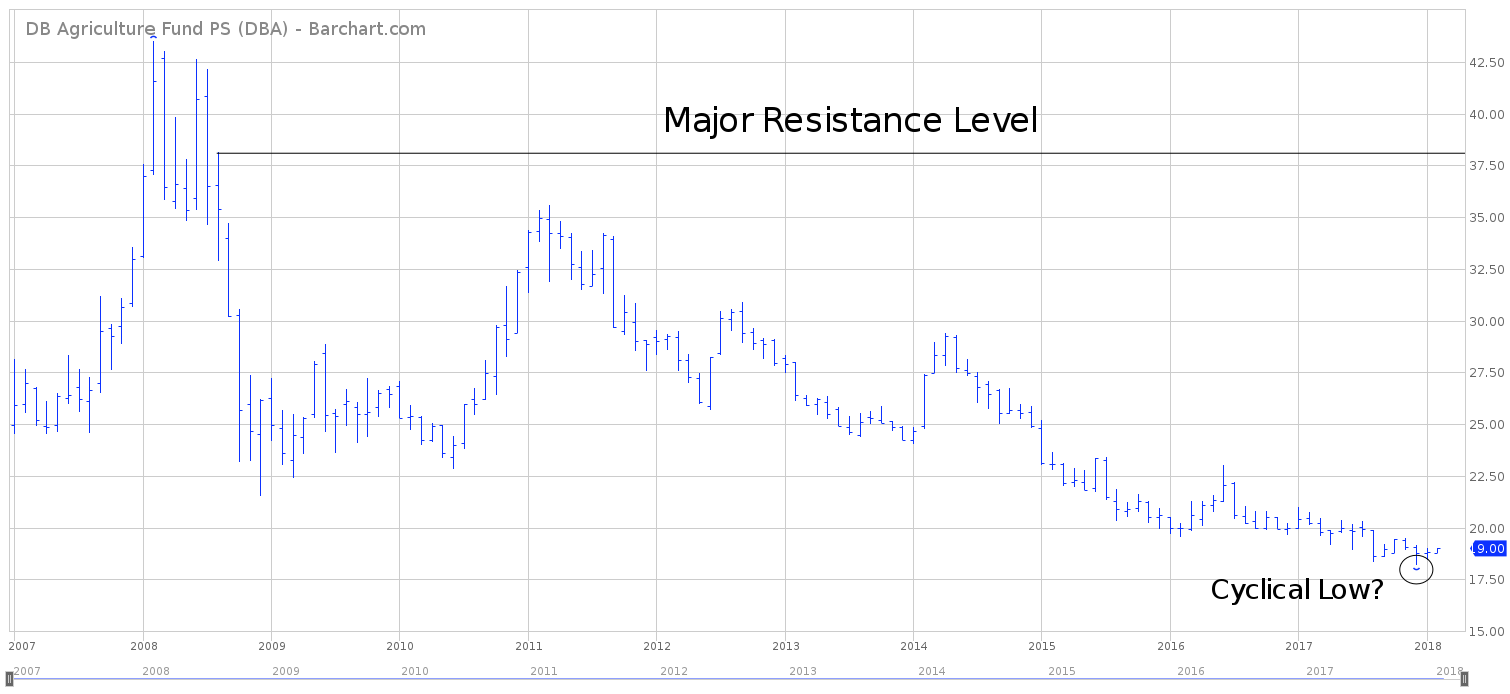
LONG-TERM CHART – DBA ETF
Please review the attached 11-year chart of DBA ETF. Essentially, the ETF has been drifting lower for the best decade with a few countertrend rallies thrown into the mix. Did DBA form an important bottom in December 2017? At least for now, there’s no technical evidence to suggest that 18.18 was an important bottom. Officially, the long-term chart pattern will remain bearish until DBA penetrates 38.16 on a weekly closing basis.