

As you probably discovered by now, there is a LOT of power and analysis available to you here. However, with that power comes responsibility.
My responsibility will be to help explain the best ways to interpret all of the data at your fingertips now. We’re doing a number of powerful scans and computations for you — and the idea is you can then quickly trade your longer term portfolios with ease. It only takes a few minutes if that once per week.
I put together this video to walk you through how to get started, as well as show you what I personally do for my trading. I’ll even show you the exact portfolio I’m trading right now
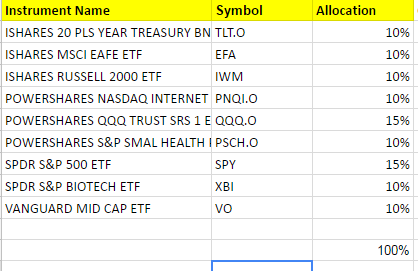
I mention in the video my personal ETF allocation. Here’s what I trade for myself, and what percentages:
4 Comments
Leave a Reply to Evelyn Gador Cancel reply
You must be logged in to post a comment.

This is great!! This is just what I needed, Like you I stopped my manage portfolios due to high fees and lackluster returns.
Thanks for your work, I can manage my portfolio with ease from now on.
Evelyn, thank you! I’m glad you can see the virtues and completely onboard with you. Cutting those high fees alone can make a world of difference. Enjoy the service.
I agree, this looks great and the presentation makes it simple to use. Can you share any backtest results you may have for the different model portfolios? I would like to see how P&L has tracked against the market for the last say 10 years (though some ETFs have not existed that long) and get an idea of the annual returns, and more particularly, the drawdowns.
Trevor, will definitely be sharing facts and figures in the weeks ahead. What I can tell you is with the traditional indices such as S&P500, Nasdaq index, etc… the losses on a position tend to average 5% – 10%. Of course you could in theory lose two in a row over time so you might use that to figure the max drawdown. Keep in mind this strategy is not designed to crush the indices — if you can meet them you will be far better off because the drawdowns rather than 40% – 50% like we’ve seen in the major markets have been more in the 10% or less area. So it feels far more relaxed since you’ll be out in the big bear markets. And, with compounding it’s not unreasonable to beat the market index, just don’t expect this to crush it. For that, we turn to our active trading system — this is about low cost investing, without the large drawdowns.