

iShares US Real Estate ETF (IYR)
Key Statistics
Minor Support Level 77.19 Minor Resistance Level 82.27
Major Support Level 35.93 Major Resistance Level 88.72
Minor Buy Signal 83.27 Minor Sell Signal 76.20
Major Buy Signal 94.99 Major Sell Signal 30.87
BRIEF OVERVIEW – iShares US Real Estate ETF
Real estate is one of the most important asset classes in the global economy. In fact the total value of all global property easily exceeds the value of stocks and bonds. Measured in US dollars, global real estate is valued at $217 trillion versus $67 trillion for global equities and $92 trillion for global bonds.
Although it doesn’t receive as much attention from investors and the financial media, real estate is the pre-eminent asset class in terms of its impact on national and international economies. Based on historical records, it has proven to be most affected by global monetary conditions and investment activity. Within the upper echelon of the macro investing community, real estate is viewed as the “canary in the coal mine” in determining the overall trend of economic growth and investment activity.
Real estate acted as a great leading indicator during the financial crisis of 2008, particularly in the United States. It was the first asset class to turn lower beginning as early as 2006. It also gave early warning signs prior to the dotcom crash in 2000. Additionally, financial historians have provided substantial evidence that real estate prices slowly began to drift lower a few years prior to the start of the Great Depression in 1929.
Why does real estate provide such predictive capabilities regarding future economic growth and financial performance? The most likely reason is because real estate activity is heavily influenced by the direction of interest rates and overall monetary policy. The vast majority of global central banks consider interest rates to be their most effective financial tool for influencing economic activity. Consequently, the real estate market is usually the first asset class to be affected by central bank decisions.
Given that real estate usually provides the first warning signs of economic trouble, investors would be well served to pay close attention to this asset class. It has been a great leading indicator during the past several decades.
In an effort to expose investors to the real estate market, BlackRock introduced a real estate ETF through its iShares family of exchange traded funds. Using the ticker symbol IYR, the iShares US Real Estate ETF began trading on June 12, 2000. IYR gives investors access to domestic real estate stocks and real estate investment trusts (REITs).
SHORT-TERM VIEW – iShares US Real Estate ETF
It certainly appears the iShares US Real Estate ETF formed an important top on December 18th @ 83.27. The bears have control of the short-term momentum. All three of the trend following indicators are in bearish territory. A weekly close above 82.27 will push the trend into bullish territory.
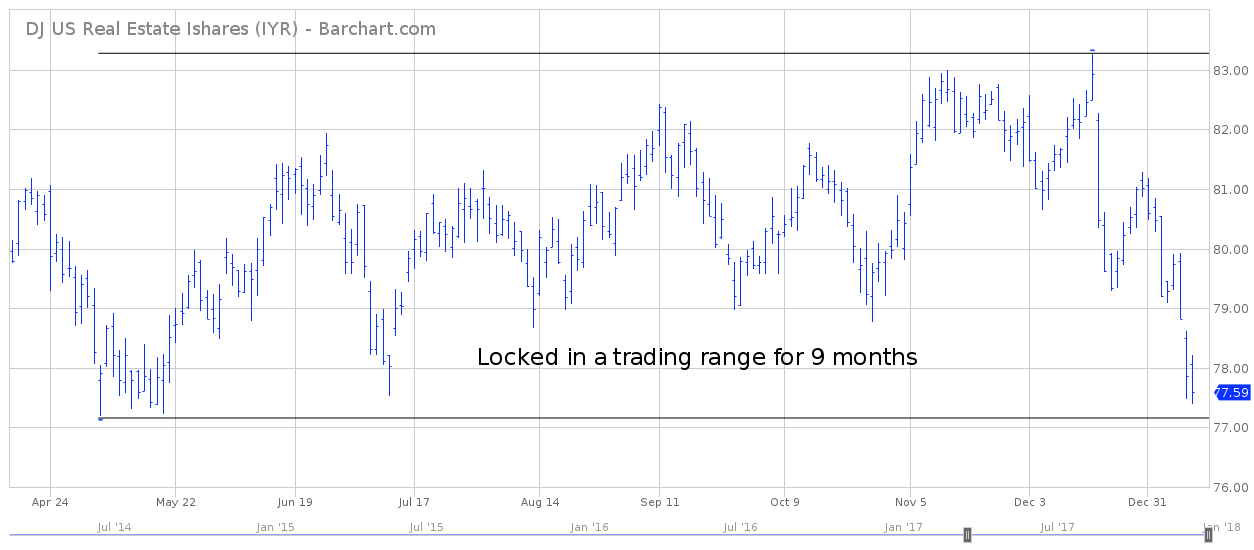
IYR has been trading sideways for nine months, with a bias to the downside during the past few weeks. The trading range is 77.19 to 83.27. Currently, the ETF is trading near the lower end of its range.
Based on the Aroon Oscillator, IYR has a fairly aggressive oversold reading of -64. The Aroon Oscillator is programmed differently than most stochastic indicators. The oscillator fluctuates between -100 and +100. A reading of 0 would indicate a neutral position. Therefore, a reading of -64 with IYR is considered sharply oversold. Most likely, the ETF is fairly close to at least a short-term bottom.
LONG-TERM VIEW – iShares US Real Estate ETF
As we previously discussed, real estate is a great leading indicator for the future direction of the global economy and investment performance. In order to determine the current trend of the market, let’s examine a “big picture” view of this asset class.
Real estate is an extremely cyclical market. It follows a fairly predictable 18-year cycle. This explains why so many financial experts and investment professionals use the real estate market as a measuring stick to determine the current state of the global economy.
There are four phases to each real estate cycle. These phases include: Recovery, Expansion, Oversupply and Recession. Which phase of the cycle are we currently experiencing? Most likely, the domestic real estate market is treading water between expansion and oversupply.
Many areas of the United States are in the “sweet spot” of the expansion phase, while other US territories are on the verge of having an oversupply problem. Therefore, taken as a whole, the US real estate market is between the 3rd and 4th phase of the cycle; probably closer to the 3rd phase. Please review the following table.
18-Year Real Estate Cycle
Cycle Date Cycle Duration Cycle Return Duration of Expansion
09/1972 – 08/1989 16 years, 11 months 13.9% per year 155 months
08/1989 – 01/2007 17 years, 5 months 14.3% per year 190 months
01/2007 – present 11 years, 0 months 4.6% per year 64 months to date
What information can we glean from this table? The most important piece of information is the length of the current real estate cycle. The current cycle (which began in January 2007) is just now entering its 11th year. Based on a typical 18-year cycle, it’s fairly safe to conclude that real estate prices will continue to remain firm for at least the next few years.
Another important statistic from the table above is the current cycle return of only 4.6% per year (based on listed equity REITs). These returns are well below the levels of the two previous real estate cycles. Most likely, this can be attributed to the fact that it took the real estate market several years to “hit its stride” following the great financial crisis of 2008. In fact, even today, the current economic recovery is rather shallow compared to previous recoveries. However, the “good news” is that this anemic recovery has kept REITs undervalued in relation to the overall stock market. Therefore, listed REIT equities could easily outperform the broad market over the course of the next few years.
The final important topic contained in the table is the duration of the expansion. The current real estate expansion is 64 months old. At first glance, it appears the expansion could easily continue for several more years in comparison to other real estate cycles. Most likely, this will not be the case because the current expansion took several years to unfold due to the 2008 financial crisis. The official starting point of the current expansion is August 2012, which was
5 ½ years into the overall cycle. Consequently, today’s expansion probably won’t last as long as previous expansions. Nevertheless, domestic real estate should continue to remain positive as least for a few more years.
The long-term view of iShares US Real Estate ETF is a mixed bag. The ETF has enjoyed a substantial rally since the 2008 financial crisis. Specifically, IYR has increased 270% since forming an important bottom in March 2009. The bulls are definitely in control of the long-term momentum. However, it does appear that IYR is running out of steam. For the past 15 months, the ETF has been unable to penetrate the 2016 high @ 85.80. This could turn into a real problem if IYR is unable to exceed 85.80 within the next 12 to 18 months.
At least for now, we will give the benefit of the doubt to the bulls. As long as IYR stays above 35.93 on a weekly closing basis, the bulls are in control of the long-term picture. Obviously, it would take a massive economic event to push IYR below 35.93 any time in the near future. Therefore, the bulls have plenty of time to “rally the troops” and push the EFT above 85.80.
Most likely, IYR is simply consolidating its huge move from the past several years. It’s not uncommon for a stock or ETF to trade sideways for several months following a substantial rally. IYR needs to catch its breath before taking off on another big advance.
SHORT-TERM CHART
Please review the attached 9-month chart of IYR. The ETF has been locked in a trading range for the past nine months. However, it certainly appears iShares US Real Estate ETF is on the verge of penetrating the lower end of its range @ 77.19. In order to reverse the bearish chart pattern, the bulls need a weekly close above 82.27.

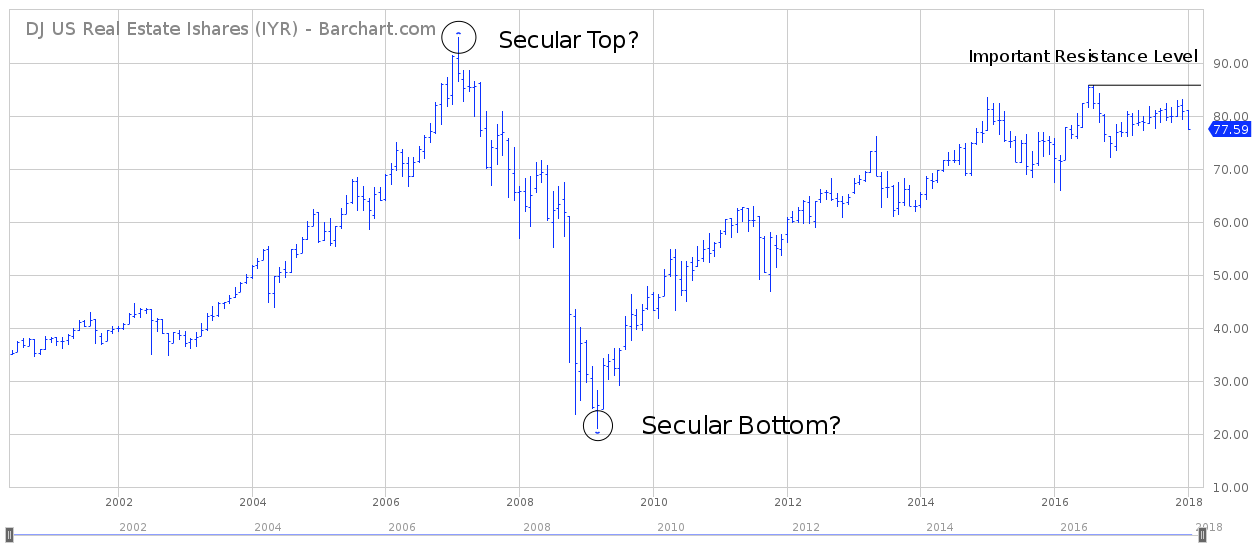
LONG-TERM CHART
Please review the attached 18-year chart of iShares US Real Estate ETF, which contains the entire trading history of the ETF. This chart presents a real dilemma. Did IYR generate a secular top in February 2007 or a secular bottom in March 2009? Given the fact that secular cycles last 20 to 30 years, it’s impossible to have a secular top and bottom within two years. Therefore, one of these cycles is labeled incorrectly. Most likely, 2007 was not a secular top. We must remember, 2007 marked the beginning of a new 18-year real estate cycle. Therefore, the final top in this cycle probably won’t occur until the early 2020s. This time frame (early 2020s) should correspond with an important top in IYR.
In order to create a bullish confirmation, IYR needs to establish a weekly close above 85.80. This should open the door to an eventual push above the 2007 peak @ 94.99.
1 Comment
Leave a Reply to Laurel Cassidy Cancel reply
You must be logged in to post a comment.

Well, you may think that it is a waste of time and you can spend the money wiser. Just look back on all the times you took a chance at a gamble without the guaranty of getting your money back if you were not satisfied with the results? I look at it if the process fails me, I still win. I get all my money back if I am not happy. If it has success, well then so do I. Minus well put all my eggs in one basket and work hard at perfecting my new found skill.