SPDR S&P 500 EFT (SPY)
Key Statistics
Minor Support Level 259.85 Minor Resistance Level 281.15
Major Support Level 107.43 Major Resistance Level 293.94
Minor Buy Signal 286.91 Minor Sell Signal 255.63
Major Buy Signal 308.83 Major Sell Signal 99.57
BRIEF OVERVIEW – SPDR S&P 500 EFT (SPY)
Given the recent volatility in the US equity markets, let’s review the overall health of the stock market. Are we finally on the verge of a vicious bear market or will the bulls recapture the momentum? Let’s examine the details.
November 9 marked the 116th month of this uninterrupted bull market. We are in the midst of the longest bull market in the history of Wall Street, which dates back to 29 May 1896. When this massive winning streak finally ends, it could go down in the record books as the greatest bull market of all-time. We are witnessing an historical event which probably won’t be repeated again for at least 100 years. Very briefly, let’s review other historical bull markets in order to place the current bull run in its proper context.
Historic Bull Markets
1900 – 2018
DATE % GAIN DURATION
08/24/1921 – 08/30/1929 495.2% 96 months
07/08/1932 – 03/10/1937 371.6% 56 months
10/11/1990 – 07/17/1998 294.8% 93 months
03/09/2009 – present 287.6% 116 months
08/12/1982 – 08/25/1987 250.4% 60 months
06/13/1949 – 04/06/1956 222.4% 82 months
11/09/1903 – 01/19/1906 144.3% 26 months
04/28/1942 – 05/29/1946 128.7% 49 months
07/30/1914 – 11/21/1916 110.5% 28 months
10/09/2002 – 10/09/2007 94.4% 60 months
11/15/1907 – 11/19/1909 89.6% 24 months
06/26/1962 – 02/09/1966 85.7% 44 months
12/19/1917 – 11/03/1919 81.4% 22 months
12/06/1974 – 09/21/1976 75.7% 21 months
10/22/1957 – 12/13/1961 75.1% 52 months
10/19/1987 – 07/16/1990 72.5% 33 months
Source Leuthold Group
As you can see from the table, the current bull market is the longest in the history of Wall Street (highlighted in green). However, it terms of pure rate of return, nothing compares to the bull market of the “roaring 20s.” The Dow Jones Industrial Average (DJIA) enjoyed a massive return of almost 500% throughout the decade of the 1920s. In order for today’s bull market to exceed the bull run of the 1920s, the Dow must trade above 38555 (before experiencing a 20% correction). Will DJIA penetrate 38555 during this current bull market? Let’s review the current health of the market.
The SPDR family of exchange traded funds introduced the S&P 500 ETF on January 22, 1993. The ticker symbol is SPY. This ETF is historically significant because it was the very first exchange traded fund listed in the United States. SPY is easily the most heavily traded ETF, with daily volume usually exceeding 100 million shares.
SHORT-TERM VIEW – SPDR S&P 500 EFT (SPY)
In regard to the short-term view of SPY, the bears are in complete control. The next important support level is 259.85. In fact, if SPY generates a weekly close below 259.85, the ETF could experience a sharp decline to 241.83. In order to recapture the momentum, the bulls need a weekly close above 286.91. At least for now, it appears as though the path of least resistance is to the downside. The bulls could have a very difficult time regaining the momentum.
Based on the Aroon Oscillator, SPY has a fairly neutral reading of +32. The Aroon Oscillator is programmed differently than most stochastic indicators. The oscillator fluctuates between
-100 and +100. A reading of 0 would indicate a neutral position. Therefore, a reading of +32 with SPY is considered neutral. Actually, this is a bad sign for the bulls. SPY has fallen rather sharply during the past six weeks. However, the Aroon Oscillator remains in neutral territory. Therefore, SPY could generate a substantial decline before the oscillator becomes oversold.
LONG-TERM VIEW – SPDR S&P 500 EFT (SPY)
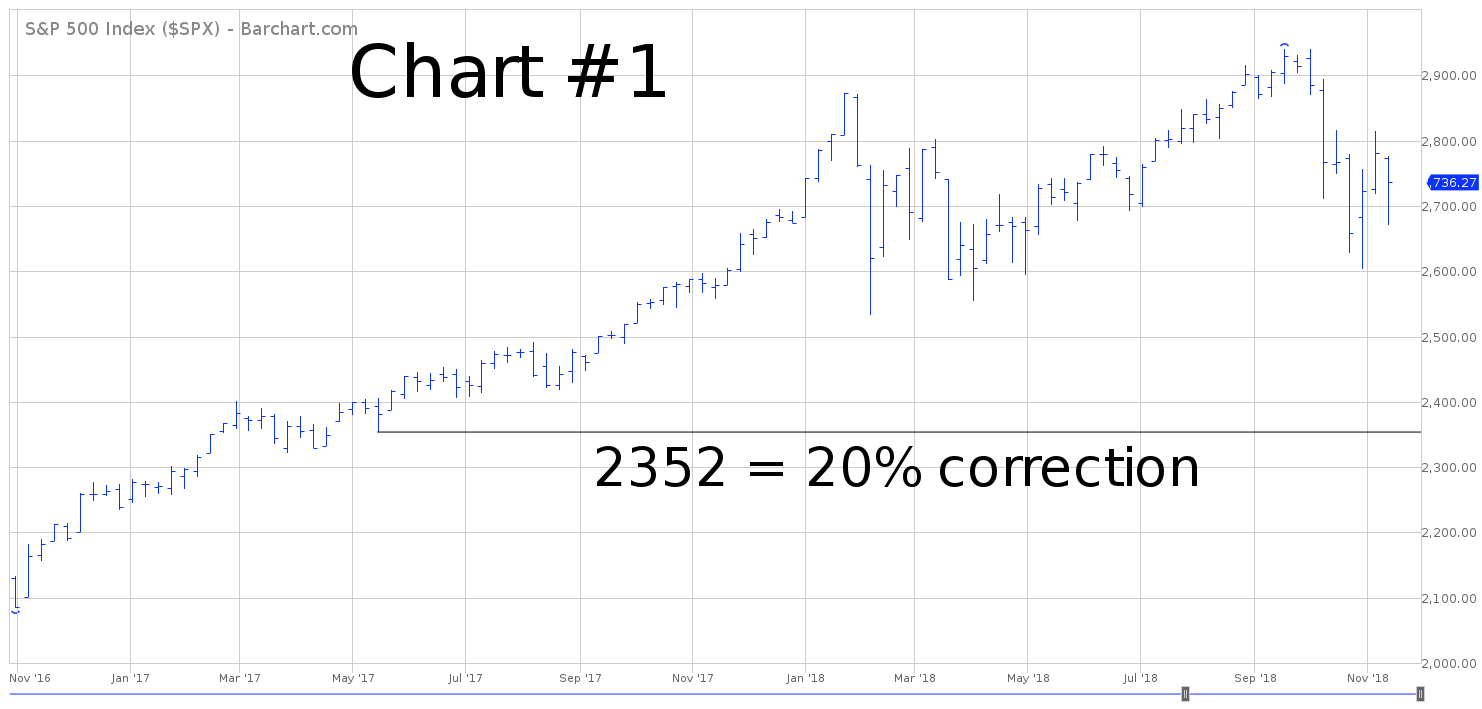
As we discussed earlier, the stock market is enjoying its longest bull market in the history of Wall Street. However, all good things must eventually end. If the S&P 500 drops 20% below its peak, the bull market will officially turn into a bear market. Please review the attached 2-year chart of the S&P 500 (Chart #1). If the market penetrates 2352, the bull run is finished.

This historic bull market began on 9 March 2009. During the past decade, there have been countless numbers of Wall Street analysts and stock market pundits who have incorrectly forecasted a top in the stock market. Based on historical data, this has been most hated bull market in history. In other words, there has been very little public participation. This probably explains why so many analysts have been completely wrong concerning their bear market forecasts.
The most recent top in the S&P occurred on 21 September @ 2940. Over the course of the next four weeks, the market suffered a rather brutal decline. The S&P fell 11.5% from its peak, generating a low on 29 October @ 2603. During the past few weeks, stocks have traded sideways with very little clear direction.
Is the stock market on the verge of suffering a substantial decline? Will the “doom and gloom” crowd finally be right (after being completely wrong for the past decade)? Based on the current macro view of the US economy as well as the current interest rate environment, it appears that the answer is “Yes.” There is a very strong likelihood that the S&P 500 will finally experience a 20% decline, which will officially mark the end of this massive bull market.
For the first time since 2007, the stock market is fighting a rising interest rate environment. The Federal Reserve has been steadily raising interest rates since December 2015. During the past three years, the federal funds rate has increased from 0% to 2.25%. Currently, the federal funds rate is at its highest level since February 2008. Eventually, rising rates will cause the domestic economy to slow down. In fact, based on recent economic numbers, it certainly appears that economic activity is beginning to wane. This explains why the stock market is probably on the verge of rolling over to the downside.
Here’s another ominous warning sign: Since 1973, there have been seven occurrences where the stock market dropped at least 10% two times in the same year. The dates include 1973, 1974, 1987, 2000, 2001, 2002 and 2008. Each of these dates marked the beginning of a bear market in stocks. Unfortunately, this pattern repeated itself in 2018. The S&P 500 produced two corrections of greater than 10% during the past nine months. Therefore, according to this pattern, stocks will enter a new bear market sometime within the next 12 months.
Obviously, bull markets can’t continue indefinitely. The current bull market will be no different. Eventually, it will end. Based on the current economic backdrop and rising level of interest rates, a strong argument could be made that an important top was formed on 21 September. Officially, the bull market will end when the S&P falls below 2352.
In regard to SPY, the long-term momentum continues to remain bullish. However, there are a few cracks appearing around the edges which could be a sign of trouble in 2019. For now, the bulls are in control as long as SPY stays above 107.43 on a weekly closing basis.
SHORT-TERM CHART – SPDR S&P 500 EFT (SPY)
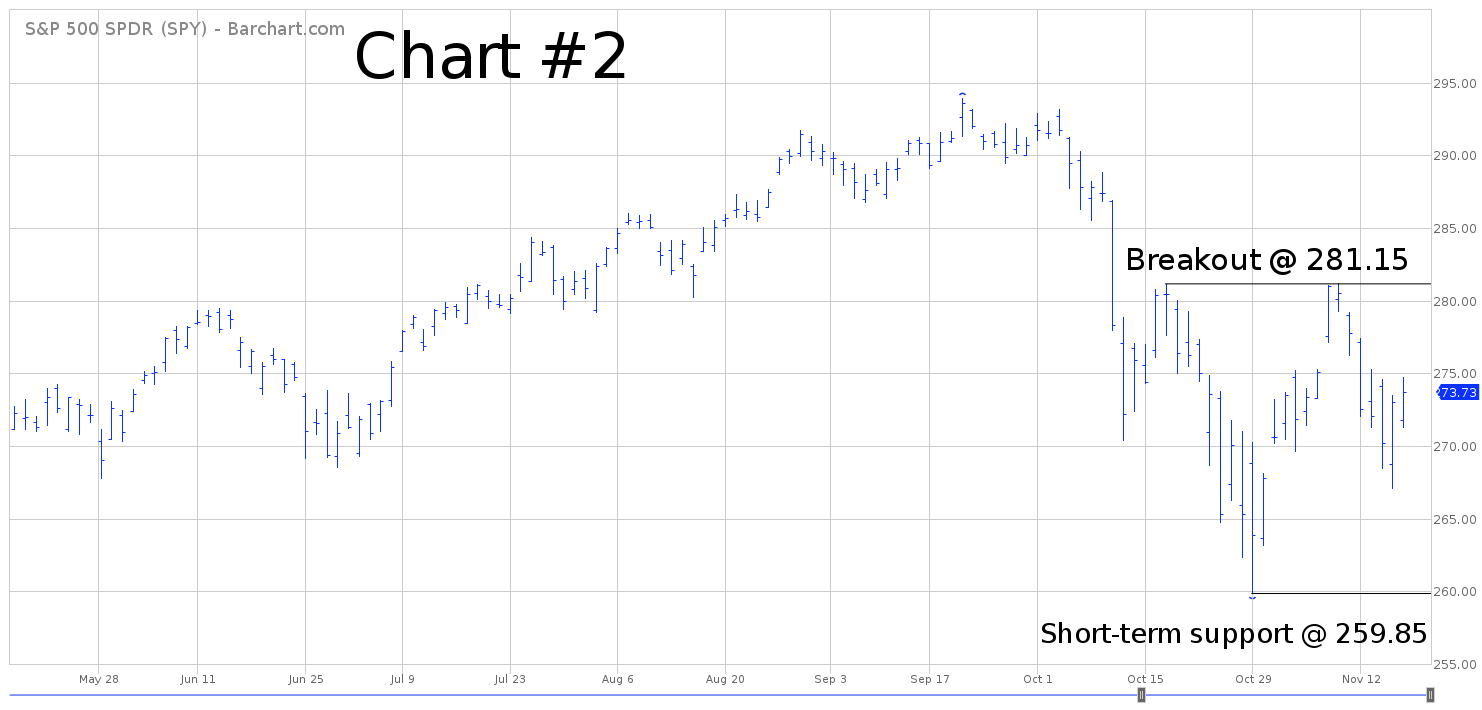
Please review the attached 6-month chart of SPY (Chart #2). The bears are in control of the short-term pattern. The next level of support is 259.85. A weekly close below 259.85 opens the door to 255.63. In order to reverse the bearish trend, the bulls need a weekly close above 281.15. Based on the current chart formation, the most likely scenario is a continuation of lower prices.
LONG-TERM CHART – SPDR S&P 500 EFT (SPY)
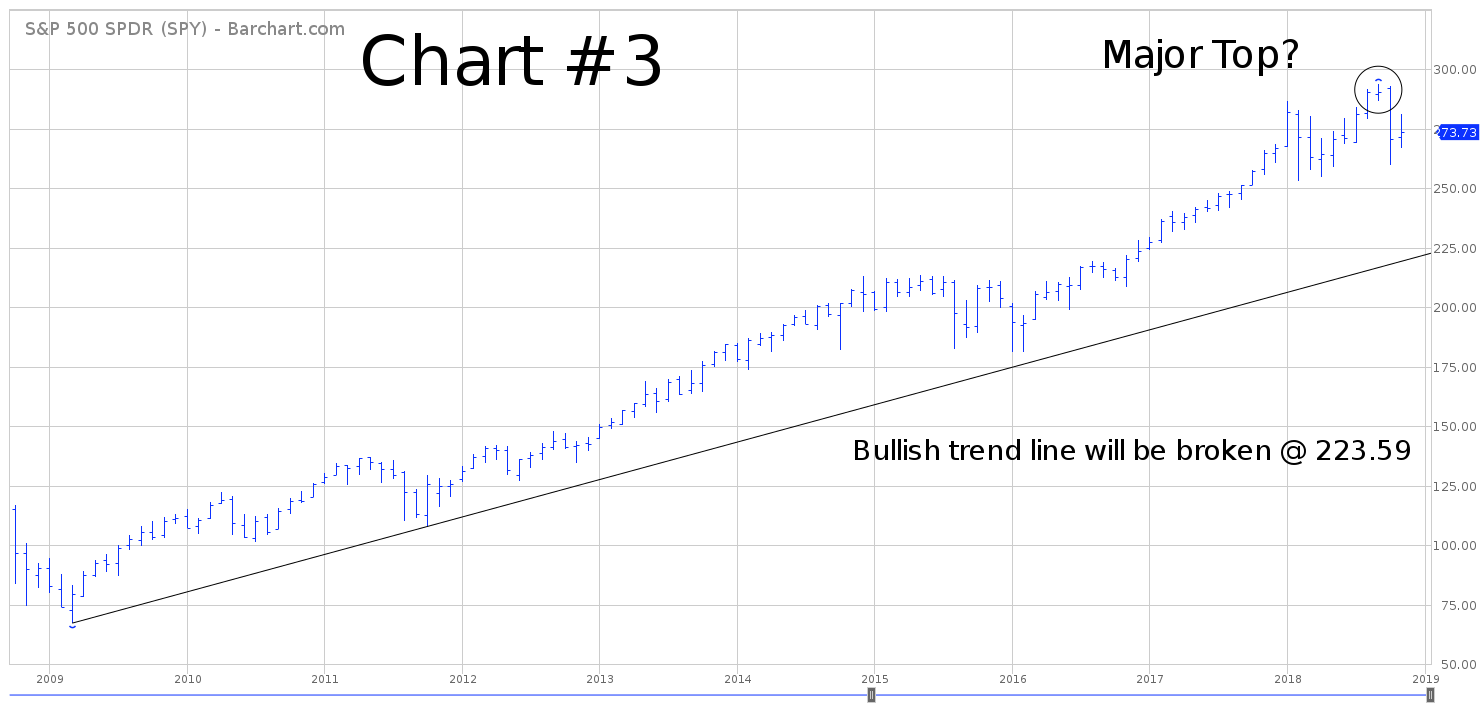
Please review the attached 15-year chart of SPY (Chart #3). The long-term chart pattern continues to remain very bullish. However, for the first time since March 2009, it does appear that SPY could be on the verge of rolling over in terms of its bullish chart pattern. The first sign of trouble would be a penetration of the bullish trend line @ 223.59. Officially, the long-term trend remains bullish until the ETF generates a weekly close below 107.43, which is highly unlikely any time in the near future.