S&P 500 Industrial Sector SPDR XLI ETF
Key Statistics (as of 10/26/17)
Daily High 72.63 Short-Term Trend Bullish
Daily Low 72.13 Intermediate-Term Trend Bullish
Daily Close 72.29 Long-Term Trend Bullish
Minor Support Level 68.37 Minor Resistance Level 73.20
Major Support Level 27.67 Major Resistance Level 76.66
Minor Buy Signal 73.81 Minor Sell Signal 67.89
Major Buy Signal 80.44 Major Sell Signal 26.79
SHORT-TERM VIEW XLI ETF
One of the most important topics among investors these days is the overall health of the US economy. The stock market rises and falls based on economic fluctuations. This explains why successful investors are constantly monitoring various indicators in order to accurately determine the strength or weakness of our nation’s economy.
There are a laundry list of indicators which can be used to gauge economic growth. A good starting point is the industrial sector of the US economy. Although the United States has slowly evolved into a service oriented economy during past few decades, the industrial sector still plays a vital role in creating jobs & consumer income.
The industrial sector is considered the “nuts & bolts” of the US economy. After all, industrial production is partly responsible for manufacturing many of the things Americans love to buy and consume.
SPDR funds launched the S&P 500 Industrial Sector ETF in December 1998, using the ticker symbol XLI. This ETF is an excellent barometer for tracking the overall health of our nation’s industrial sector. XLI offers a perfect blend of companies as a proxy for the US industrial economy.
Top 10 Holdings of S&P 500 Industrial Sector SPDR ETF
Boeing Company 3M Company General Electric
Honeywell International Union Pacific United Technologies
Caterpillar Inc United Parcel Service Lockheed Martin
General Dynamics
As you can see, XLI includes a diverse mixture of economically sensitive companies. There are a total of 69 firms incorporated in the ETF.
The bulls are in complete control of XLI. The ETF has been moving relentlessly higher for the past eight weeks. In fact, XLI is trading near its all-time historic high of 73.20, which occurred on Oct 24th. It doesn’t get more bullish than this. In order to recapture the short-term bearish momentum, the bears need a weekly close below 68.37.
Based on the Aroon Oscillator, XLI is hovering in overbought territory with a reading of 84.
The market is overdue for at least a short-term correction. However, XLI has been continuously overbought for the past five weeks. As a general rule, stochastic oscillators are fairly unreliable when a particular market is in the middle of a strong trend. Markets can remain overbought or oversold for a considerable period of time before the trend finally reverses.
LONG-TERM VIEW XLI ETF
The long-term view of XLI is incredibly bullish. In December, XLI will celebrate its 19th year of continuous trading. The ETF is trading within a few pennies of its all-time high. Based on the bullish performance of XLI over the course of the past several months, its rather difficult to argue that the industrial sector of the US economy is slowing down. In fact, the entire US economy appears to be humming along quite nicely.
During the past 15 to 18 months, the vast majority of Wall Street economists completely underestimated the strength of the US economy (as well as the global economy). In 2015, economists were forecasting a severe slowdown for 2016, particularly within the industrial sector. This bearish forecast was based on the fact that several government economic reports and surveys were beginning to show signs of weakness during the 2nd half of 2015.
During this particular time (2nd half of 2015), XLI was struggling to generate a sustainable rally. In fact, the ETF drifted sideways to lower throughout most of 2015. XLI made a very important bottom in January 2016 @ 46.82.
January 2016 also marked the beginning of an important turnaround in the US economy. Several key economic indicators began to show signs of life. These indicators included industrial production, consumer confidence, capacity utilization, unemployment claims and
factory orders.
Despite the obvious signs of improved economic activity, the majority of professional economists continued to stick with their “doom & gloom” forecast of a borderline recession beginning in late 2016. Of course, these forecasts have proven to be completely wrong.
As we look back to the beginning of 2016, it’s incredibly apparent that XLI was a great leading indicator in forecasting the upturn in our nation’s economy. The Wall Street economists who, in 2016, were predicting more economic weakness, would have been well served by simply examining the performance of XLI.
This isn’t the first time XLI has accurately forecasted major turning points in the US economy. In October 2002, the ETF formed an important bottom, which marked the end of the “dot com recession” from 2000 & 2001. Five years later, in October 2007, XLI generated a major top. This top coincided with the peak in the US housing bubble. In March 2009, the economy began to slowly recover from the housing bubble. This also marked the exact date of a secular low in XLI.
According to the National Bureau of Economic Research, the last recession in the United States ended in the Spring of 2009. The US has enjoyed 8 ½ years of continuous economic growth. The secular low in XLI coincided perfectly with the end of the recession in 2009. XLI has proven to be an amazing forecasting tool in determining major turning points in the US economy.
As we discussed previously, XLI is trading near an all-time historic high. Therefore, it appears rather unlikely the US economy will rollover to the downside any time in the near future. At least for now, XLI is forecasting continued industrial economic growth as we transition into 2018.
From a long-term perspective, the important number to watch is 76.66. A weekly close above 76.66 opens the door to 80.44. In order to confirm the end of the current secular bull market, XLI must generate a monthly close below 27.67. Obviously, it would take a dramatic collapse of our nation’s industrial economy to push XLI below 27.67. Therefore, for the moment, the bulls are in complete control of XLI.
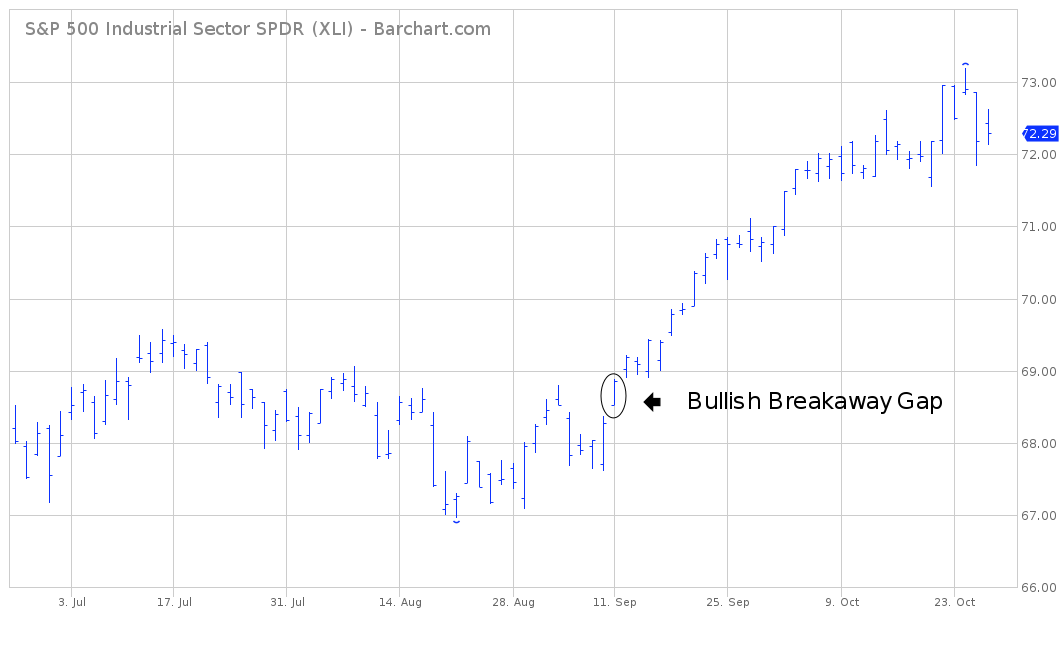
SHORT-TERM CHART XLI ETF
Please review the attached 4-month chart of XLI. The market generated a bullish breakaway gap on Sep 11th. The momentum is definitely in favor of the bulls. The short-term chart pattern will continue to remain bullish as long as the gap remains unfilled. A weekly close below 68.37 will give the bears the upper hand.
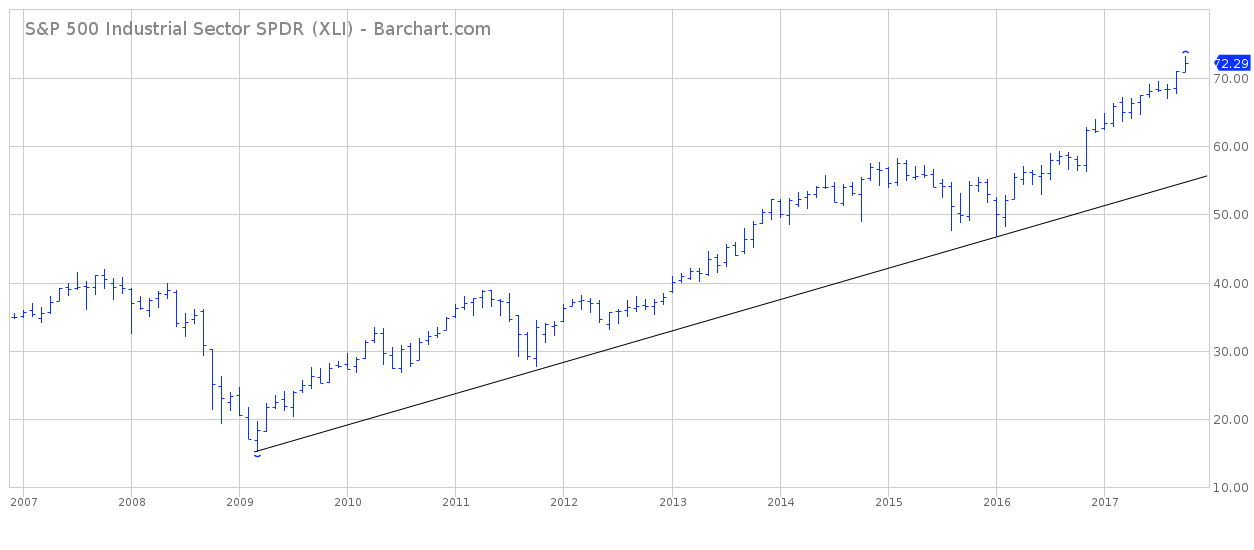
LONG-TERM CHART
Attached, you will find a 10-year chart of XLI. There’s no other way to describe this chart pattern but extremely bullish. XLI has been in an uninterrupted bull market for eight consecutive years. It doesn’t get more bullish than this. There’s no indication XLI will turn bearish any time in the near future.