S&P Retail SPDR ETF (XRT)
Key Statistics (as of 11/16/17 close)
Daily High 40.75 Short-Term Trend Bullish
Daily Low 39.96 Intermediate-Term Trend Bullish
Daily Close 40.61 Long-Term Trend Bullish
Minor Support Level 38.38 Minor Resistance Level 41.99
Major Support Level 21.75 Major Resistance Level 49.72
Minor Buy Signal 42.07 Minor Sell Signal 38.18
Major Buy Signal 51.25 Major Sell Signal 18.22
BRIEF OVERVIEW – SPDR ETF XRT
Is retail dead? Has Amazon completely altered the way Americans shop and consume? Will the traditional model of brick & mortar stores become obsolete within the next decade? The best way to answer these questions is to dig into the numbers and evaluate how the investment community is treating the retail industry.
The United States retail industry is a critically important component of our nation’s overall economy. For example, in 2016, US gross domestic product (GDP) was $18.62 trillion. Consumer spending accounted for almost 70% of total GDP @ $12.82 trillion. Within the category of consumer spending, retail sales for 2016 amounted to $4.85 trillion. Therefore, 26% of total GDP in 2016 was derived from retail sales. This explains why investors are always focused on the retail industry and why everyone is trying to determine the future spending habits of American consumers.
SPDR funds launched the S&P Retail Sector ETF in June 2006, using the ticker symbol XRT. This ETF is used as a barometer for tracking the overall health of our nation’s retail sector. However, upon further examination of XRT, it’s rather apparent that the ETF is heavily weighted in favor of the “old school” brick & mortar retail establishments. Please examine the list below.
Top 20 Holdings of S&P Retail Sector SPDR ETF
Company % Holdings Purchase Date
L Brands 1.64% 08/16/2011
Tailored Brands 1.58% 08/16/2011
Groupon 1.51% 09/24/2012
Group 1 Automotive 1.49% 08/16/2011
Five Below 1.47% 09/23/2013
Amazon.com 1.47% 05/04/2017
AutoNation 1.46% 05/04/2017
Urban Outfitters 1.44% 05/15/2015
Wal-Mart Stores 1.44% 05/04/2017
American Eagle Outfitters 1.41% 12/27/2016
Dollar Tree 1.41% 08/16/2011
Murphy USA 1.40% 09/23/2013
Express Inc 1.40% 12/27/2016
Big Lots 1.40% 05/15/2015
Burlington Stores 1.39% 06/23/2014
Ross Stores 1.38% 04/27/2017
Dollar General 1.38% 05/04/2017
Netflix 1.38% 08/16/2011
AutoZone 1.37% 05/04/2017
Costco 1.36% 08/16/2011
As you can see from the list, the top 20 holdings of XRT includes only three “true” online retail establishments. These three companies are Groupon, Amazon and Netflix. The remaining 17 companies are more traditionally known for their brick & mortar sales. Upon further examination of the list, you may also notice there are several companies listed which are involved in the automobile industry. According to the US Census Bureau (which compiles the monthly retail sales data), auto sales & auto parts sales are a major component of overall retail sales. This explains why there are several auto dealers and auto parts dealers included in the holdings of XRT.
There are a total of 87 firms which comprise XRT. Without question, the vast majority of the firms are traditional retail establishments with physical stores. Therefore, XRT is a better proxy for traditional retailers versus online retailers. By examining the historical price performance of XRT, this will give us a good indication concerning the future direction of the “old school” retailers.
SHORT-TERM VIEW – SPDR ETF XRT
XRT drifted relentlessly lower for the first eight months of 2017. At least for now, it appears the ETF formed a short-term bottom on August 21st @ 37.72. XRT has managed to string together a rather unimpressive rally during the past ten weeks. The recent advance of the past few days has managed to push all three of the trend following momentum indicators into bullish territory.
Despite the bullish momentum indicators, the bears are in control of XRT from a short-term perspective. The next level of support is 38.38. In order to generate a short-term bullish breakout, XRT needs a weekly close above 41.99. Going forward, the most likely short-term direction is lower prices.
Based on the Aroon Oscillator, XRT has a slightly oversold reading of -48. The Aroon Oscillator is programmed differently than most stochastic indicators. The oscillator fluctuates between
-100 and +100. A reading of 0 would indicate a neutral position. Therefore, a reading of -48 with XRT is moderately oversold. However, the ETF could easily generate another sharp leg to the downside before it becomes extremely oversold.
LONG-TERM VIEW – SPDR ETF XRT
From November 2008 through March 2015, XRT enjoyed an incredible rally of almost 600%, as the global economy slowly recovered from the Great Recession of 2008. During the same time period (11/2008 – 03/2015), the S&P 500 produced a gain of 186%. The retail sector dramatically outperformed the overall stock market during that 6 ½ year trading window.
Unfortunately, for the XRT bulls, things have turned rather sour during the past two years. XRT formed an important top on March 31, 2015 @ 51.25. The ETF has been grinding its way lower for the past 2 ½ years, with a few feeble rally attempts along the way. To make matters worse, XRT has been drifting lower while at the same time, the overall stock market is in the midst of one of the most spectacular bull markets of all-time. XRT has declined 22% since March 2015. Conversely, the S&P 500 has gained 23% during the same time span.
Why has XRT underperformed the S&P 500 since March 2015? What seems to be the problem? The most obvious place to investigate would be the level of retail sales during the past two years. After all, if retail sales are declining, logic would dictate that retail stocks would perform rather poorly. However, if we examine US retail sales for the past 30 months, it becomes quickly apparent that overall retail sales have been quite healthy. In 2015, total retail sales were $4.78 trillion. The number increased to $4.85 trillion in 2016. The projection for 2017 is $5.12 trillion.
If retail sales are increasing, why is XRT underperforming the overall stock market? Because (as we discussed a few minutes ago) the majority of the ETF is comprised of traditional retail establishments. The financial performance of the brick & mortar companies are pushing down the price of XRT. Most likely, this trend will continue for the next several years as consumers slowly transition their buying power away from physical stores to online stores.
When we think of online shopping, what is the first store that pops into our minds? Of course, the answer is Amazon. Without question, Amazon is the “king of the jungle” in terms of online shopping. In fact, Amazon is more powerful than any retail establishment, whether it be a physical store or an online store.
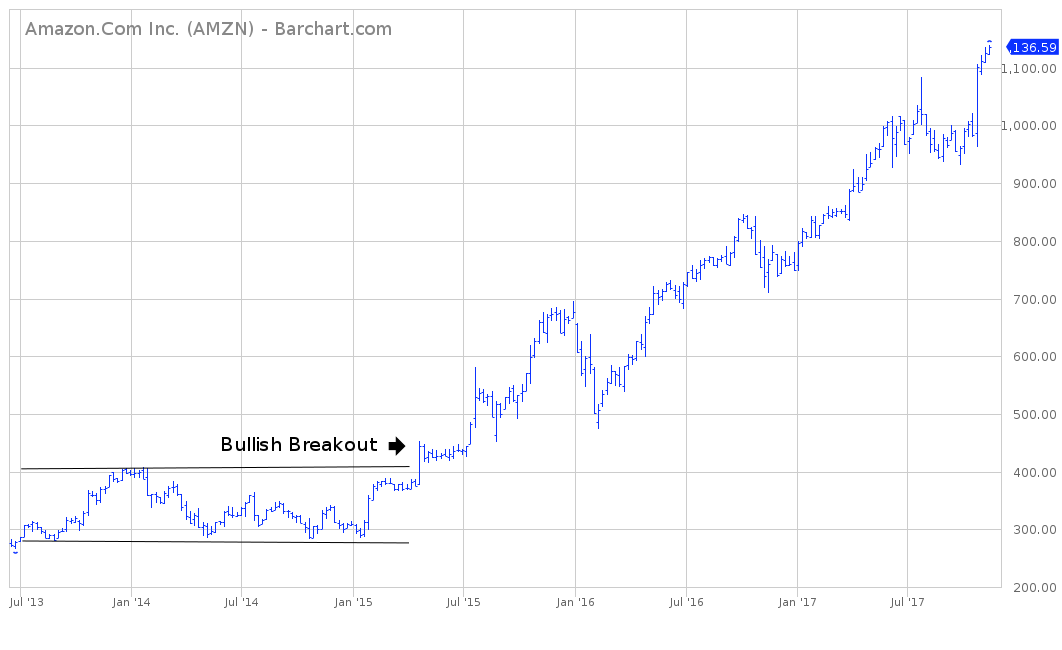
If we examine a price chart of Amazon, it becomes quite clear when investors actually crowned the company as the overall leader in the retail sector. Please review the attached 4-year chart of Amazon. From the Summer of 2013 through the Spring of 2015, the stock was trapped in a boring trading range. As you can see from the chart, the true breakout occurred in April 2015.

More specifically, Amazon generated a bullish breakout near the 408 level during the week of April 20, 2015. The stock has never looked back. In other words, Amazon has never traded below 408 since April 20, 2015. What an incredibly powerful breakout!
Next, let’s examine a 4-year chart of XRT for the same time period (Chart #1). You will notice something very interesting! While Amazon was on the verge of generating a massive breakout in April 2015, XRT was forming its all-time historic high during the exact same time period. In other words, April 2015 marked the date when Wall Street decided that Amazon was the future of the retail industry and the traditional model of brick & mortar was dead. In the eyes of the Wall Street community, the “old school” retail establishments were quickly being replaced by Amazon.
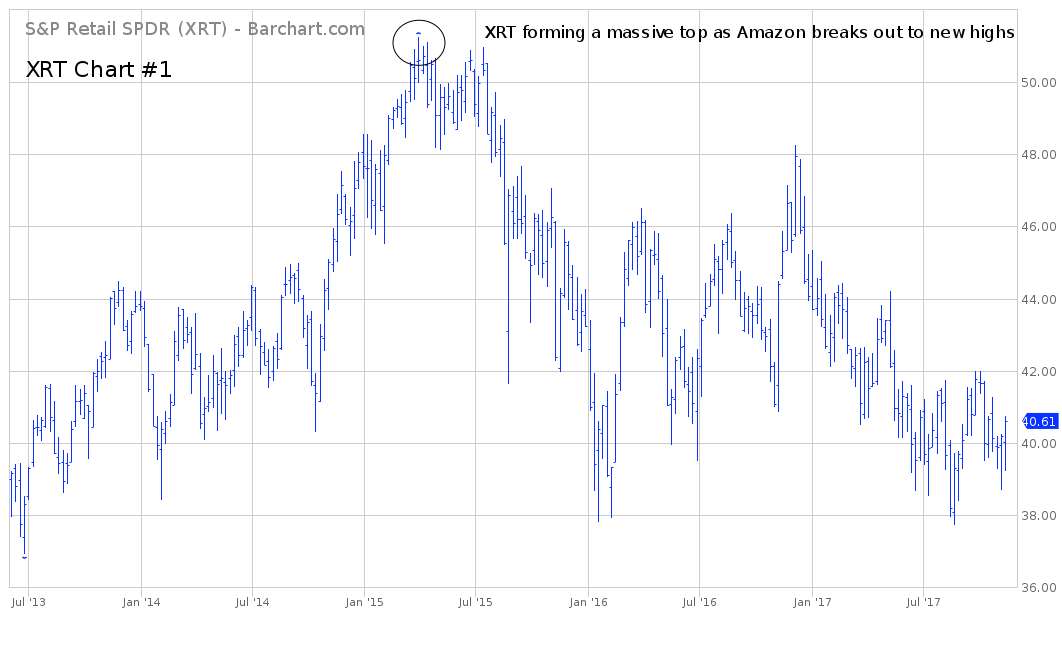
For the past 2 ½ years, Amazon’s stock price has literally exploded. The stock has increased 179% since its bullish breakout in April 2015. During the same time period, XRT has produced very disappointing results for its investors. The ETF has generated a loss of 21%.
In response to our original question, “Is retail dead?,” it certainly appears the traditional retail establishments are dying a slow death. At the same time, those retailers with a very strong online presence are doing quite well.
It’s highly unlikely the brick & mortar retail model will completely disappear. However, based on the recent price performance of XRT, these companies will need to undergo some drastic changes in order to compete with the likes of Amazon. Without question, major disruptions are occurring within the retail industry. Not everyone will survive.
From a long-term perspective, the bears are in control of XRT. Depending on how the retail industry shakes out during the next few years, a strong argument could be made that XRT formed a long-term secular top in March 2015 @ 51.25. A weekly close below 21.75 would confirm March 2015 as a secular top. The bulls need a close above 49.72 in order to push the long-term momentum in their favor.
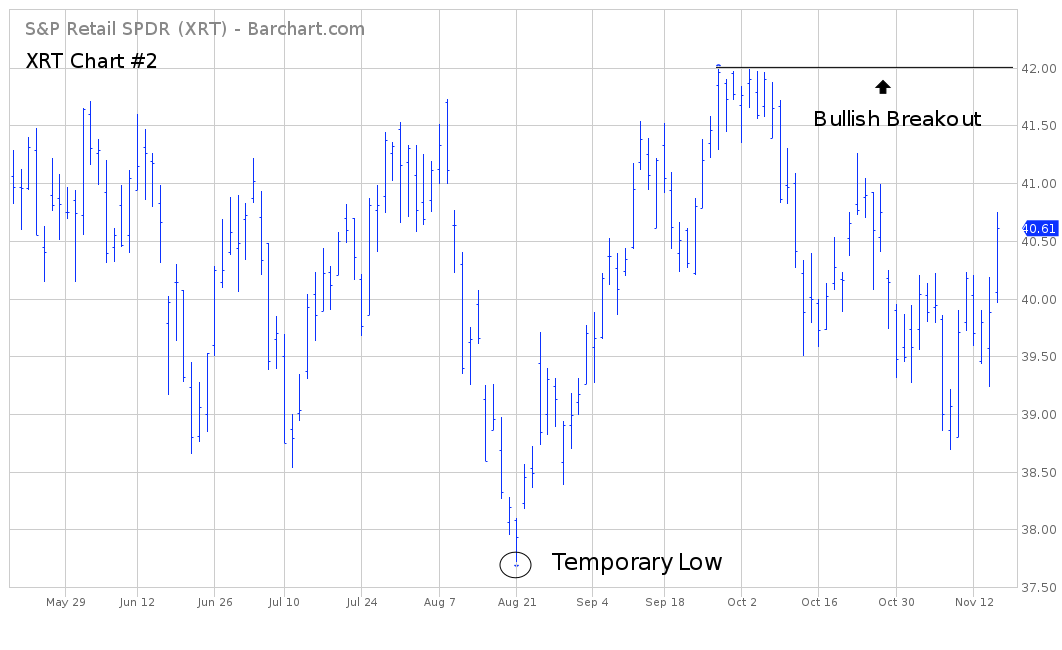
SHORT-TERM CHART
Please review the attached 6-month chart of XRT (Chart #2). A short-term bottom was formed on August 21st @ 37.72. However, this low will most likely be penetrated within the next six months. A weekly close above 41.99 could cause this forecast to be wrong.
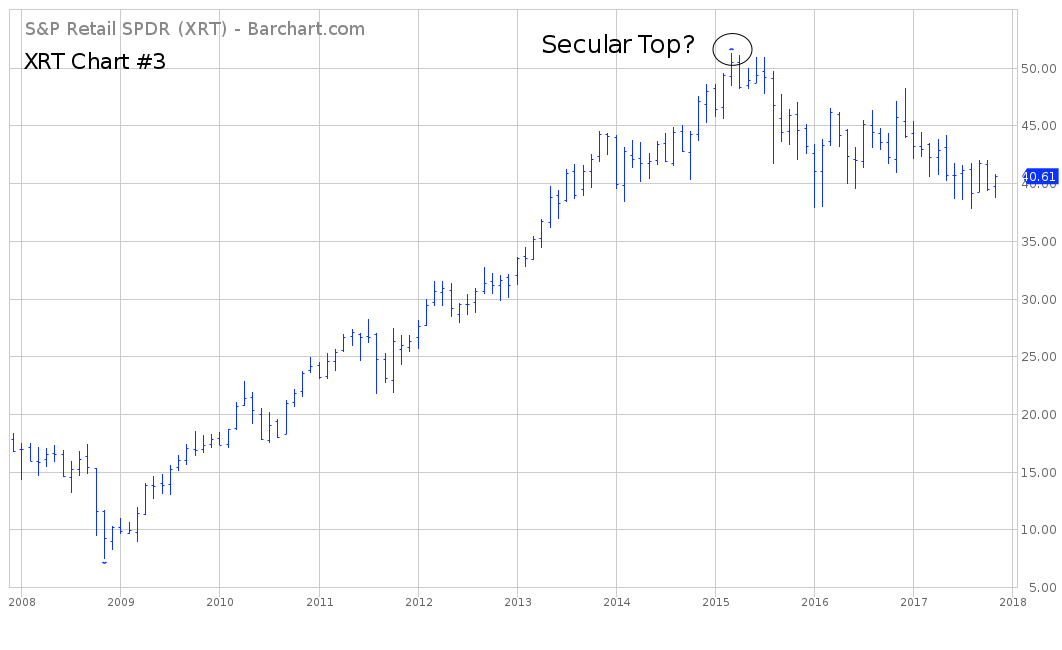
LONG-TERM CHART
Please review the attached 10-year chart of XRT (Chart #3). Most likely, XRT formed a secular top in March 2015 @ 51.25. Given the disruptions occurring within the retail industry, it will be very difficult for XRT to exceed 51.25 any time in the near future.