

ProShares Short VIX Short-Term Futures ETF (SVXY)
Key Statistics
Daily High 130.59 Short-Term Trend Bullish
Daily Low 128.88 Intermediate-Term Trend Bullish
Daily Close 130.48 Long-Term Trend Bullish
Minor Support Level 109.25 Minor Resistance Level 131.00
Major Support Level 23.91 Major Resistance Level 183.42
Minor Buy Signal 134.43 Minor Sell Signal 106.28
Major Buy Signal 187.74 Major Sell Signal 19.71
BRIEF OVERVIEW – ProShares Short VIX ETF
In the world of investments, we hear a great deal of talk about, “volatility.” What exactly is volatility and how do we measure it? Is it possible to invest in volatility? Let’s review some of the basic facts concerning this topic.
For many novice investors, volatility is a rather difficult concept to comprehend. In fact, even advanced traders have a challenging time understanding the proper meaning. In its simplest form, volatility is a statistical measurement used to determine the size or range of returns for a given security or market index. It measures the degree of risk associated with a particular stock or index. As a general rule, the higher the volatility, the greater the risk. For example, a high volatility stock is capable of experiencing violent price fluctuations over a short period of time. Conversely, a low volatility stock does not fluctuate dramatically. Instead, it changes in value at a steady pace over a long time period.
In terms of individual stocks, a popular measure of volatility is known as beta. A beta approximates the overall volatility of a security’s return against the return of a relevant benchmark (usually the S&P 500). For example, a stock with a beta value of 1.2 has historically moved 120% for every 100% move in the benchmark. Is it possible for a stock to have a beta of less than 1.0? The answer is, “Yes.” Let’s assume XYZ Corporation has a beta of 0.9%. This means XYZ Corporation moves 90% for every 100% move in the benchmark index. Therefore, the stock is actually less volatile than the underlying index.
The ProShares family of exchange traded funds introduced the Short VIX Short-Term Futures ETF on October 3, 2011, using the ticker symbol SVXY. This is an inverse ETF which moves in the opposite direction of its underlying benchmark. The underlying benchmark for SVXY is the S&P 500 VIX Short-Term Futures Index. What is the S&P 500 VIX Index? It is an index used to track the volatility of the S&P 500, as measured by the prices of the VIX futures contracts. Therefore, an investor in SVXY profits from decreases in the volatility of the S&P 500. In a nutshell, SVXY is simply a vehicle for investors to speculate on the volatility of the S&P 500. SVXY rises in value as the S&P volatility decreases. SVXY declines in value as S&P volatility increases.
SHORT-TERM VIEW – ProShares Short VIX ETF
SVXY has generated an incredibly bullish performance throughout the entire year of 2017. In fact, the lowest price level in 2017 occurred on the very first trading day of the year. SVXY investors have enjoyed a 176.3% rate of return during the past 52 weeks.
The momentum is definitely in favor of the bulls. The next short-term resistance level is the December 27th high @ 131.00. A weekly close below 109.25 would shift the short-term momentum in favor of the bears.
Based on the Aroon Oscillator, SVXY has a slightly overbought reading of +68. The Aroon Oscillator is programmed differently than most stochastic indicators. The oscillator fluctuates between -100 and +100. A reading of 0 would indicate a neutral position. Therefore, a reading of +68 with SVXY is moderately overbought. However, the ETF could easily generate another sharp leg to the upside before it becomes extremely overbought.
LONG-TERM VIEW – ProShares Short VIX ETF
For the past 12 months, stock market volatility has been chronically low. In fact, volatility in the S&P 500 (as measured by the VIX Index) is hovering near its lowest level in the 25-year history of the VIX Index.
The VIX Index is also known as the “fear index.” Based on the extremely low value of VIX, this tells us that traders and investors have absolutely no fear of an impending stock market crash or brutal decline. In other words, there is an incredible amount of complacency within the investing community. Everyone is convinced the stock market will continue to push its way higher.
As previously mentioned, the VIX Index has 25 years of historical price performance. It was created in 1992. Therefore, we can examine prior time periods when stock market volatility was excessively low.
The most recent period of low stock market volatility occurred in 2006 & 2007, which eventually culminated with the brutal recession of 2008. Another period of extremely low volatility took place in 1995 & 1996. This was followed by the Asian financial crisis of 1997.
Based on the historical data, it certainly appears that periods of low volatility are eventually followed by excessive volatility. Therefore, the anemic volatility of the past 12 months will ultimately lead to a violent reversal in the stock market.
Of course, the most important question is, “When will the decline begin?” According to the historical VIX data, the current period of low volatility could easily continue into 2019. It’s not uncommon for stock market volatility to remain at depressed levels for two years or longer. Traders who are anticipating a stock market crash based on a low VIX reading, could be waiting for a long time.
The bulls have complete control of SVXY from a long-term perspective. The next major level of resistance is 183.42. In order to reverse the long-term momentum to the downside, the bears need a weekly close below 23.91. It would take a huge spike in S&P volatility to push SVXY below 23.91. At least for now, the bulls have the wind at their backs.
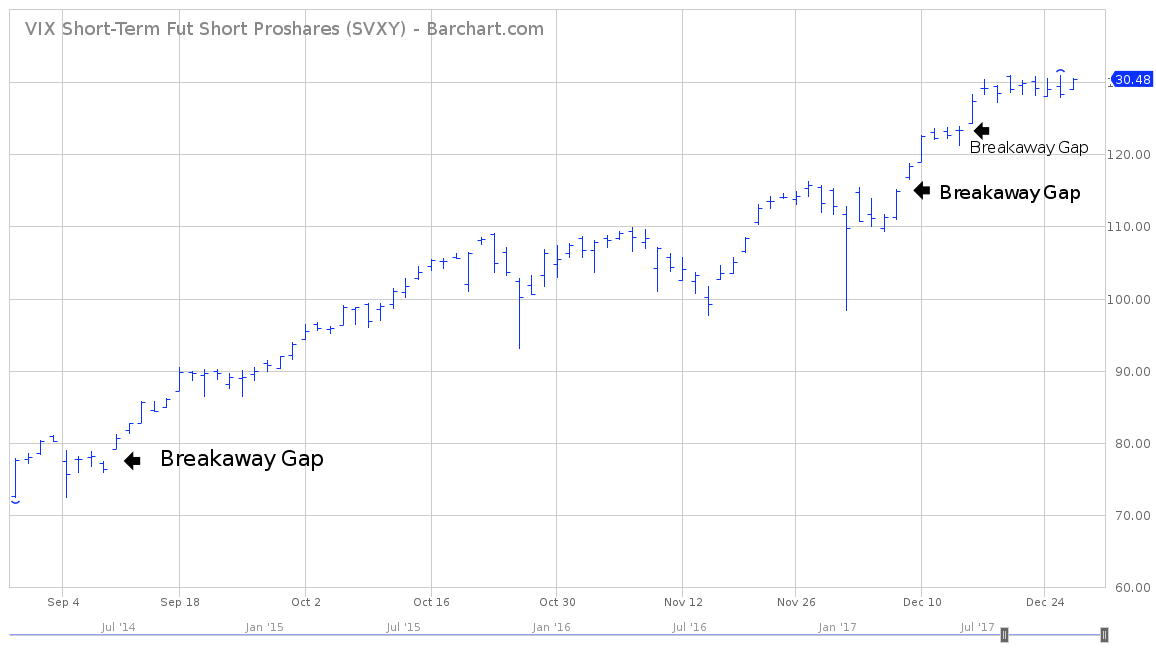
SHORT-TERM CHART
Please review the attached 4-month chart of SVXY. The ETF has generated three breakaway gaps during the past few months. The next short-term resistance level is 131.00. The bears need a weekly close below 109.25 to push the trend in their favor.
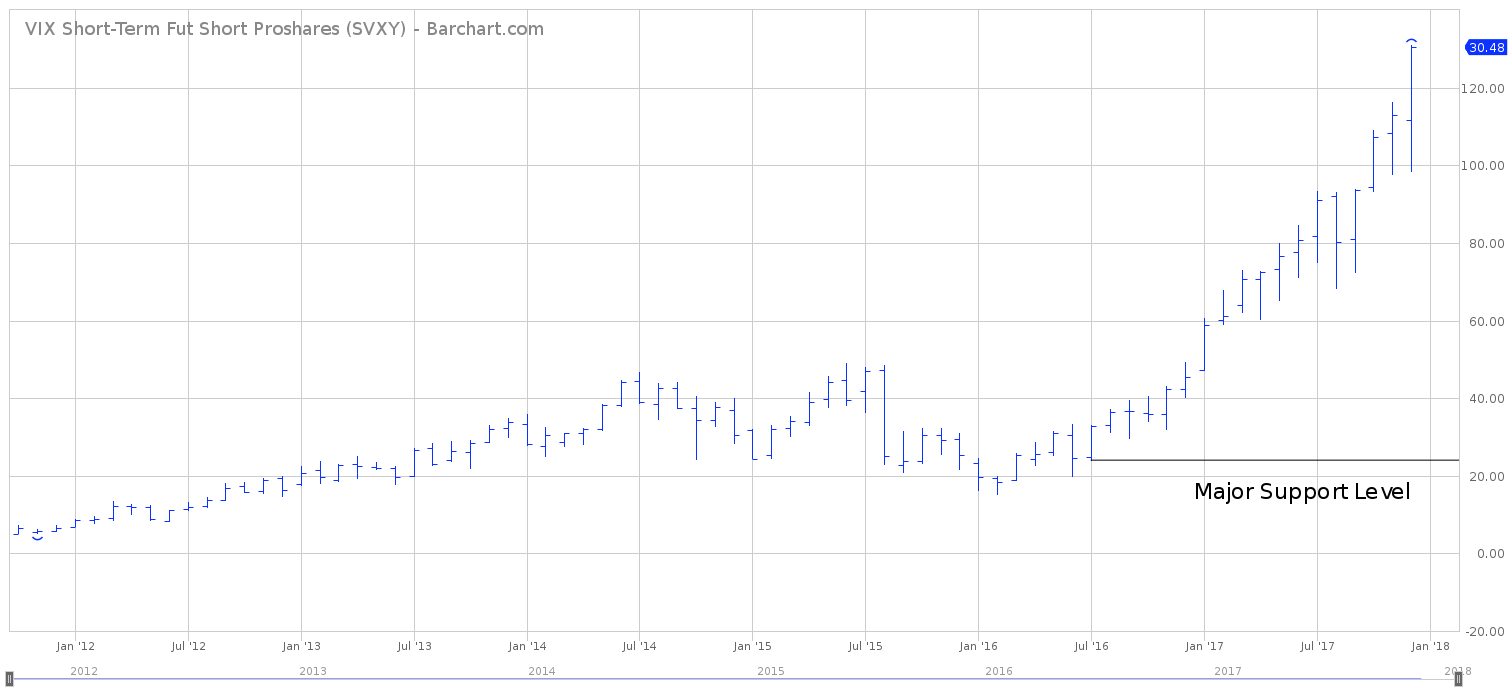
LONG-TERM CHART
Please review the attached 6-year chart of SVXY. The ETF has been pushing its way higher since it was introduced in October 2011. Basically, SVXY has been in a continuous bull market for six years (with a moderate decline near the end of 2015). The major support level is 23.91.

