

iShares MSCI Saudi Arabia ETF (KSA)
Key Statistics – iShares KSA ETF
Minor Support Level 27.87 Minor Resistance Level 32.87
Major Support Level 22.59 Major Resistance Level 35.10
Minor Buy Signal 33.43 Minor Sell Signal 27.06
Major Buy Signal 36.77 Major Sell Signal 20.38
BRIEF OVERVIEW – iShares KSA ETF
The Kingdom of Saudi Arabia is one of the most secretive and misunderstood countries in the world. Officially a sovereign state, Saudi Arabia was founded in 1932 by Ibn Saud, when he united four regions into a single state. Today, it is the largest sovereign state in the Middle East. From a geographical standpoint, it is the fifth largest country in Asia and the second largest in the Arab world, behind Algeria. From a global standpoint, Saudi Arabia is the twelfth largest country in the world.
In terms of its government formation, Saudi Arabia is an absolute monarchy, where the King is both the head of state and the government. All executive decisions are made on the basis of consultation among the senior princes of the royal family. The actual day-to-day operations of the government are managed by the Crown Prince. Mohammad bin Salman is the current Crown Prince, appointed by his father (King Salman) on 21 June 2017. In addition to Crown Prince, bin Salman is also the country’s deputy prime minister, chairman of the Council for Economic and Development Affairs and also Saudi Arabia’s minister of defense.
The economy of Saudi Arabia is one of the top 20 economies in the world and a member of the G20. The country is heavily dependent on oil as its main source of revenue. It has the second largest proven petroleum reserves in the world and the fifth largest proven natural gas reserves. Saudi Arabia has the second most valuable natural resources in the world, valued at $34.4 trillion.
In regard to gross domestic product (GDP), inflation rate, government debt and GDP growth rate, Saudi Arabia has enjoyed incredible success during the past two decades. The vast majority of this success can be attributed to the secular bull market in crude oil beginning in 1999. Please review the following table.
Important Economic Statistics
Year GDP GDP Growth Rate Inflation Rate Government Debt
2000 708.9 5.6% 1.1% (-) 86.7%
2001 716.3 1.2% (-) 0.1% 93.1%
2002 706.8 2.8% (-) 0.6% 96.4%
2003 801.9 11.2% 0.6% 81.6%
2004 889.5 8.0% 0.3% 62.9%
2005 969.3 5.6% 0.5% 37.3%
2006 1,026.9 2.8% 1.9% 25.8%
2007 1,073.7 1.8% 5.0% 17.1%
2008 1,163.2 6.3% 6.0% 12.1%
2009 1,147.9 2.1% (-) 4.2% 14.0%
2010 1,217.3 4.8% 3.7% 8.4%
2011 1,370.2 10.3% 3.8% 5.4%
2012 1,471.0 5.4% 2.9% 3.0%
2013 1,534.7 2.7% 3.5% 2.1%
2014 1,619.7 3.7% 2.2% 1.6%
2015 1,704.5 4.1% 1.3% 5.8%
2016 1,755.1 1.7% 2.0% 13.1%
2017 1,773.6 0.7% (-) 0.8% (-) 17.3%
Source International Monetary Fund | GDP Billions US Dollars | Government Debt % of GDP
As you can see from the table, Saudi Arabia has enjoyed almost two decades of amazing economic growth and prosperity. More importantly, the growth was not fueled by wasteful government spending. As an added bonus, the country achieved two decades of rising GDP against a backdrop of incredibly mild inflation.
It’s no coincidence that the country’s GDP growth began to accelerate precisely when the price of crude oil began to move higher in 2002. Why? Because Saudi Arabia is heavily dependent on energy as its main source of revenue. The country struggled economically throughout the 1980s and 1990s, as crude oil was locked in a bear market. With the exception of 2008 and 2016, the entire energy complex has been in a bull market for the past 19 years. Please review the attached crude oil chart.
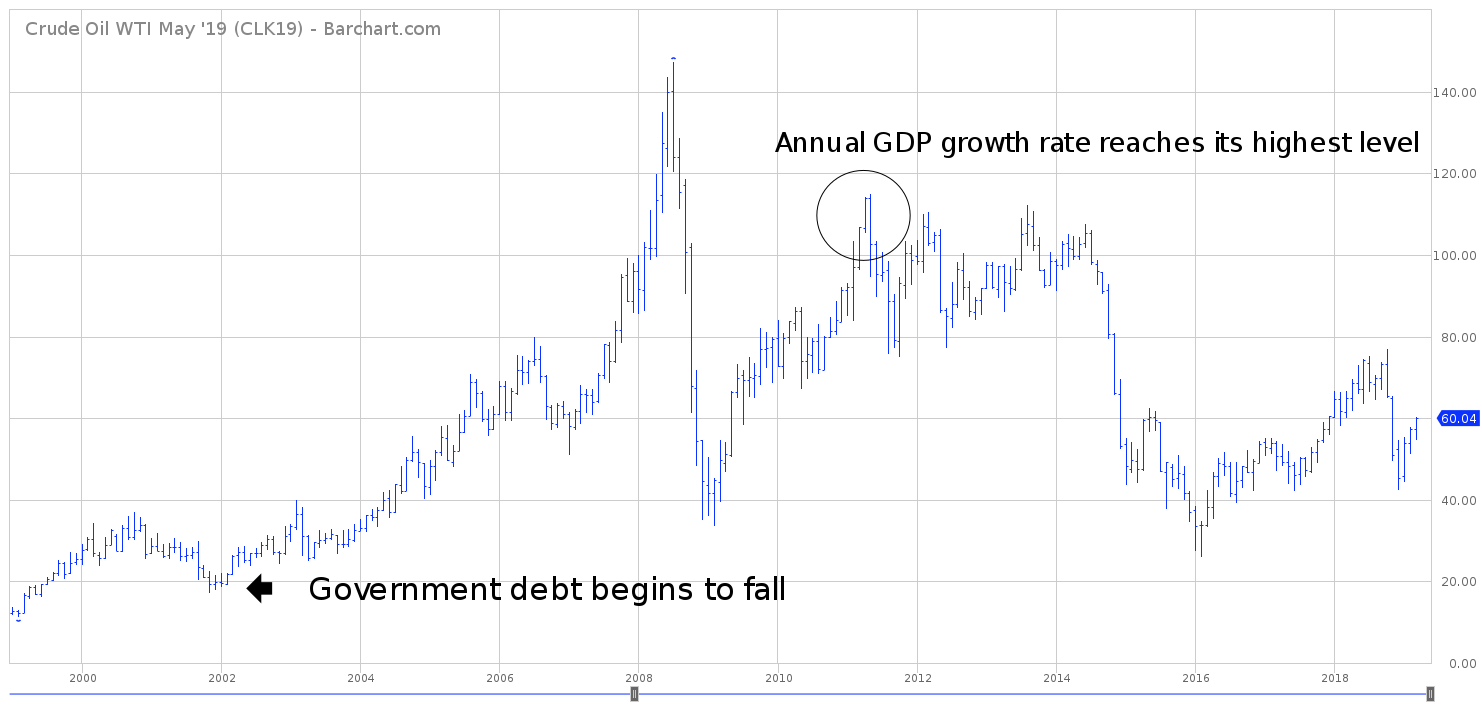
Without question, the most impressive number in the table is the country’s debt-to-GDP ratio. Saudi Arabia has been able systematically reduce its internal debt over the course of the past two decades. In 2002, the country’s debt was approaching 100% of its GDP. Within 12 years, Saudi Arabia had basically eliminated its debt. This is truly a remarkable feat in today’s debt laden society. Saudi Arabia and Russia have (by far) the lowest debt-to-GDP ratio among all G20 nations.
In an effort to provide investors with exposure to the Russian economy, the iShares family of exchange traded funds (managed by BlackRock) launched the MSCI Saudi Arabia ETF on 16 September 2015. The ticker symbol is KSA. The ETF provides investors with an opportunity to invest in some of the largest and most liquid companies in Saudi Arabia. KSA has a total of 69 different holdings. The top five companies include Saudi Basic Industries, Al Rajhi Bank, National Commercial Bank, Saudi Telecom and Samba Financial. The 52-week trading range is 27.06 to 32.56.
SHORT-TERM VIEW – iShares KSA ETF
During the past six weeks, KSA has made a series of new all-time highs. Obviously, the bull are in complete control of the ETF. In order to swing the momentum in their favor, the bears need a weekly close below 27.87. The most likely scenario is a continuation of higher prices. There is nothing to suggest that KSA is on the verge of rolling over to the downside.
LONG-TERM VIEW – iShares KSA ETF
Among all G20 countries, Saudi Arabia has the potential to generate the highest rate of return by foreign investors over the course of the next 10 to 20 years. The Saudi royal family has taken several steps to encourage direct foreign investments. The most radical change occurred on 21 June 2017, when King Salman bin Abdulaziz Al Saud appointed his son to become the Crown Prince. Mohammad bin Salman, at the age of 31, became the youngest Crown Prince in the history of Saudi Arabia.
The new Crown Prince has been viewed quite favorably within the investment community. Within the past 18 months, MbS (as he is colloquially known) has enacted several reforms within the Saudi government which are viewed as “pro-business.” For example, MbS removed the ban on female drivers, opened the first sports stadium to permit female attendees and encouraged businesses to hire more female workers. Additionally, the Crown Prince has opened the country to international tourists by introducing an e-visa system, which can now easily be issued to foreigners from the internet in order to attend events and festivals.
Without question, the Crown Prince’s most ambitious project is Saudi Vision 2030, which was unveiled on 25 April 2016. Saudi Vision 2030 is an aggressive plan to reduce Saudi Arabia’s dependence on oil, diversify its economy and develop public service sectors such as health, education, infrastructure, recreation and tourism. Saudi Vision 2030 has three main objectives.
These objectives include:
01. A vibrant society involving urbanism, culture and entertainment, sports, increased life expectancy and Saudi heritage.
02. A thriving economy by including more women in the workforce, increased public investment, non-oil exports and establishing a private investment fund.
03. Modernization by allowing equal access to women, creating more e-government programs and encouraging more household savings.
Several foreign multi-national corporations have agreed to make direct investments in Saudi Vision 2030. As of March 2019, the project is considered to be ahead of schedule. Without question, Saudi Vision 2030 will be the most important project of Mohammad bin Salman’s reign as Crown Prince.
For the first time in its history, Saudi Arabia is opening its borders to foreign investments. Thanks to the pro-growth strategies of the new Crown Prince, the future looks bright for the world’s second most valuable natural resource country.
In regard to the long-term view of KSA, the bulls are in complete control of the ETF. KSA is trading near its all-time high. In order to recapture the momentum, the bears need a weekly close below 22.59. At least for now, the momentum is clearly in favor of the bulls.
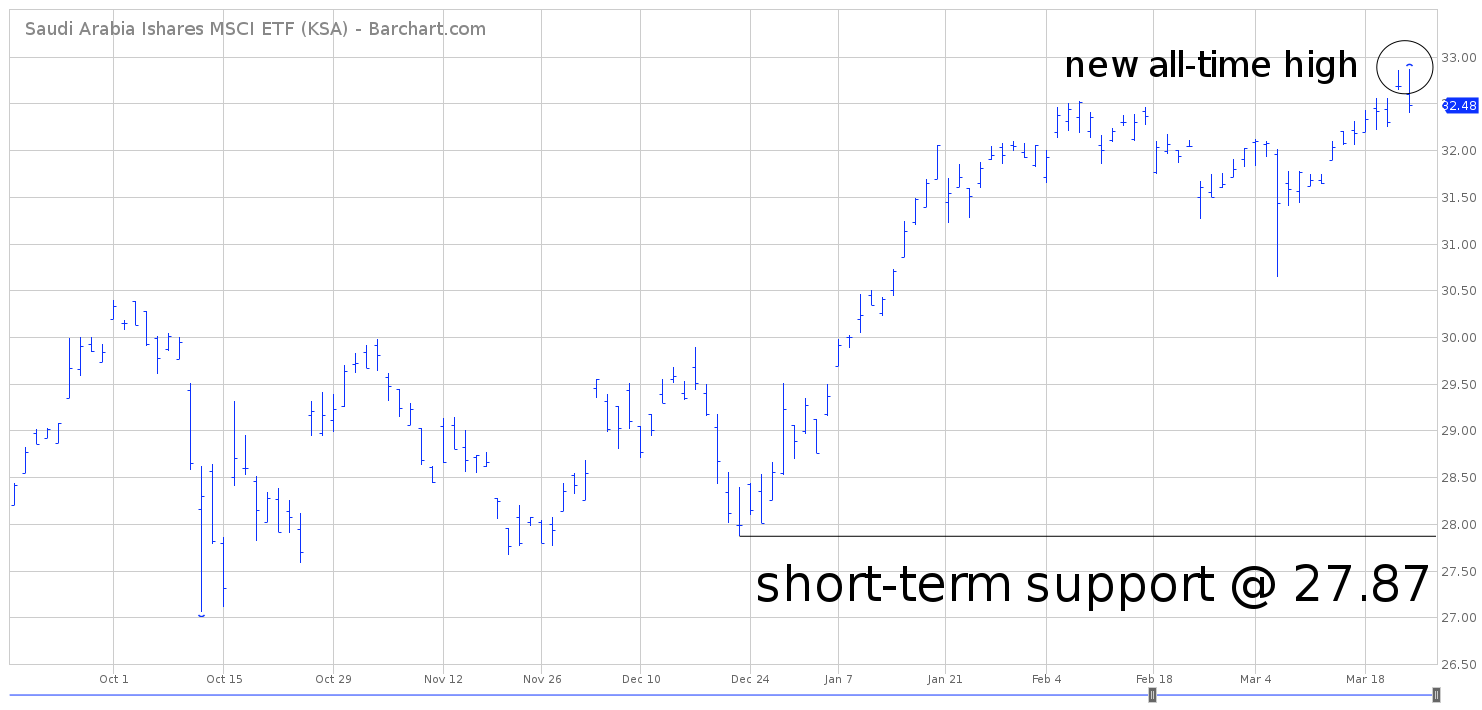
SHORT-TERM CHART – iShares KSA ETF
Please review the 6-month chart of KSA. The ETF has an incredibly bullish short-term chart pattern. KSA recorded a new all-time high as recently as 22 March. It doesn’t get more bullish than a new all-time high. The trend will turn bearish on a weekly close below 27.87. A reversal into bearish territory is highly unlikely unless the overall stock market turns lower.
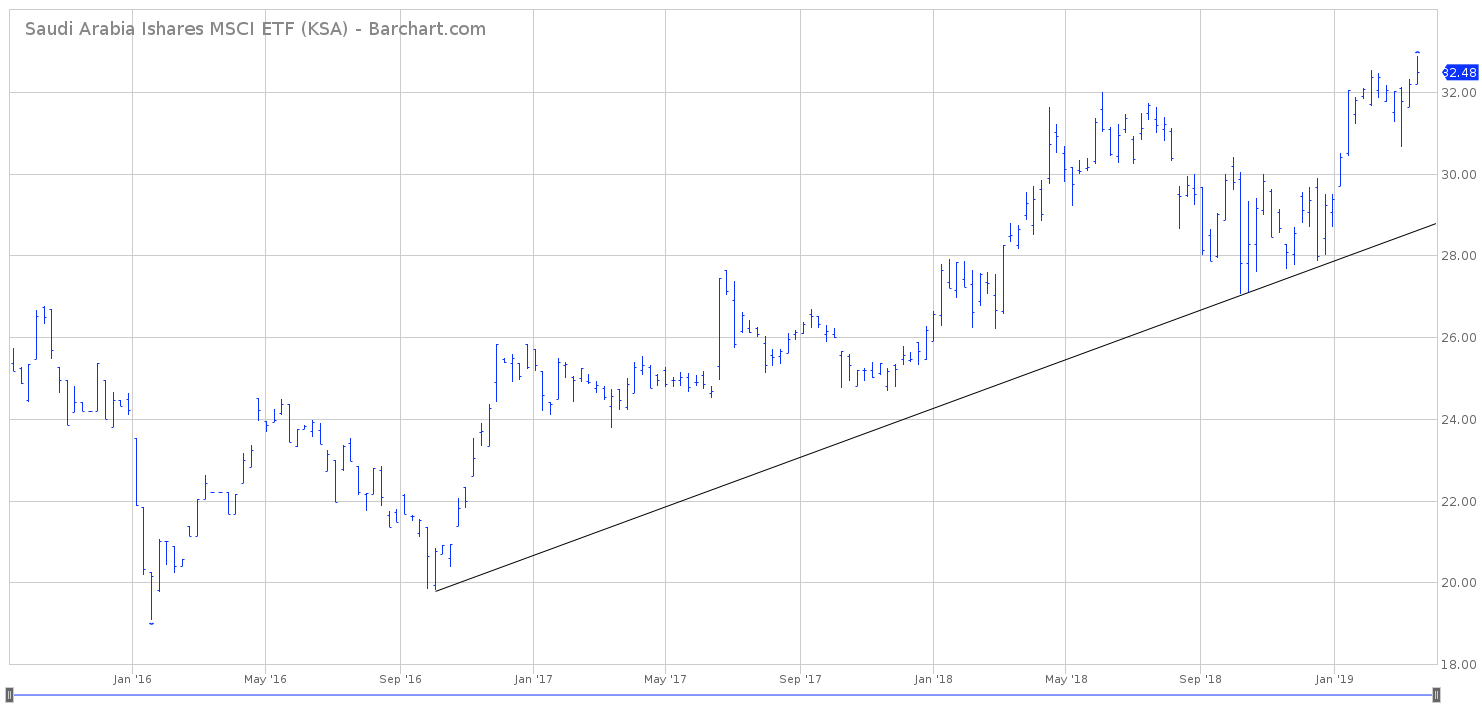
LONG-TERM CHART – iShares KSA ETF
Please review the 4-year chart of KSA. This chart includes the entire trading history of the ETF. KSA has a beautiful upward sloping trendline dating back to October 2016. The long-term chart pattern will remain bullish as long as KSA stays above 22.59 on a weekly closing basis.

