

iShares MSCI France ETF EWQ
Key Statistics
Daily Close 32.09 Long-Term Trend (100 SMA) Bullish
Minor Support Level 29.84 Minor Resistance Level 32.35
Major Support Level 14.39 Major Resistance Level 37.96
Minor Buy Signal 32.97 Minor Sell Signal 29.48
Major Buy Signal 40.08 Major Sell Signal 13.05
BRIEF OVERVIEW – EWQ
The Eurozone is a monetary union consisting of 19 member states which have adopted the Euro as their common currency. France is a member of the Eurozone. It is the third largest Eurozone economy, behind only Germany and the UK. On a global basis, France has the ninth largest economy in the world. In terms of Global Fortune 500 companies, the country is home to 31 of the 500 largest companies in the world.
For the first time in six years, the French economy is gaining momentum. In 2017, the country’s economic activity expanded at its fastest pace since 2011. Officially, the French economy grew by 1.9% in 2017, well above its growth rate in 2016 of 1.1%. The forecast for 2018 is 2.0%.
Why is the French economy finally showing signs of life after six years of stagnation? The economy began to gather momentum following the French elections in May 2017. President Emmanuel Macron has been successful in implementing his pro-growth agenda within the business community. He has created a new level of energy in the country with his strategy to provide more help to the self-employed by reducing restrictions on the hiring and firing of employees. His economic plan is beginning to show positive results.
The MSCI France ETF was introduced on March 12, 1996, under the ticker symbol of EWQ. This ETF is part of the iShares family of exchange traded funds. EWQ is designed to provide investors with exposure to large and mid-sized companies in France. Specifically, the ETF consists of 79 different holdings.
SHORT-TERM VIEW – EWQ
The recent “mini crash” in the stock market has pushed the short-term momentum in favor of the bears. Last week’s stock market plunge is a perfect example of how quickly the momentum can switch from bullish to bearish. The next level of support is 29.84. A weekly close below 29.84 would be extremely bearish for EWQ.
For the past several months, the bulls were in complete control of EWQ. However, the ETF began to unravel very quickly following the recent stock market decline. In order to regain the upper hand, the bulls need a weekly close above 32.35. Based on the price action during the past few days, the bulls could recapture the momentum rather quickly.
LONG-TERM VIEW – EWQ
The entire Eurozone economy has been struggling to regain its footing following the global financial crisis of 2008. However, during the past 12 months, all Eurozone economies have started to show signs of definite improvement. As we discussed briefly, the economic activity in France generated a powerful breakout in 2017. The country increased its output of goods and services by 1.9%, its strongest performance since 2011. Was last year’s performance the beginning of a sustainable trend in the French economy? Based on the country’s recent economic activity, it certainly appears France could be in the early stages of outperforming its Eurozone counterparts.
As we discussed briefly, President Macron’s economic proposals are encouraging business leaders to expand their operations. French companies are hiring at the fastest pace in 17 years, thanks to Macron’s ability to overhaul the country’s strict labor code. Companies now have the ability to negotiate contracts directly with their workers. Previously, employers were forced to follow strict labor union agreements. The new labor agreement will give companies more flexibility in terms of hiring and firing workers.
Many French companies have announced plans to increase capital expenditures in 2018. For the first time in several years, firms are expanding their businesses which should increase the country’s economic output.
The biggest winner of Macron’s new pro-business agenda will be the banking sector. Banks will experience an increase in corporate loan demand, as firms boost capital expenditures. Additionally, mortgage lending will expand thanks to Macron’s ability to reduce French housing taxes.
President Macron’s biggest impact on the French economy will be his plan to lower corporate tax rates from 33% to 25% by 2022. This will be a huge contributing factor to increasing the country’s economic output over the course of the next several years.
For the past decade, the French economy has been underperforming its Eurozone counterparts. However, the country is finally beginning to turn the corner in regard to economic expansion. During the next decade, France has the ability to outperform many European countries as its new economic plan brings prosperity to the entire country.
The long-tern view of EWQ is neutral. However, the trend has definitely been bullish during the past two years. In order to switch the long-term momentum from neutral to bullish, EWQ must produce a weekly close above 37.96. The bears can gain the upper hand on a weekly close below 14.39. The most likely scenario is an eventual push above 37.96.
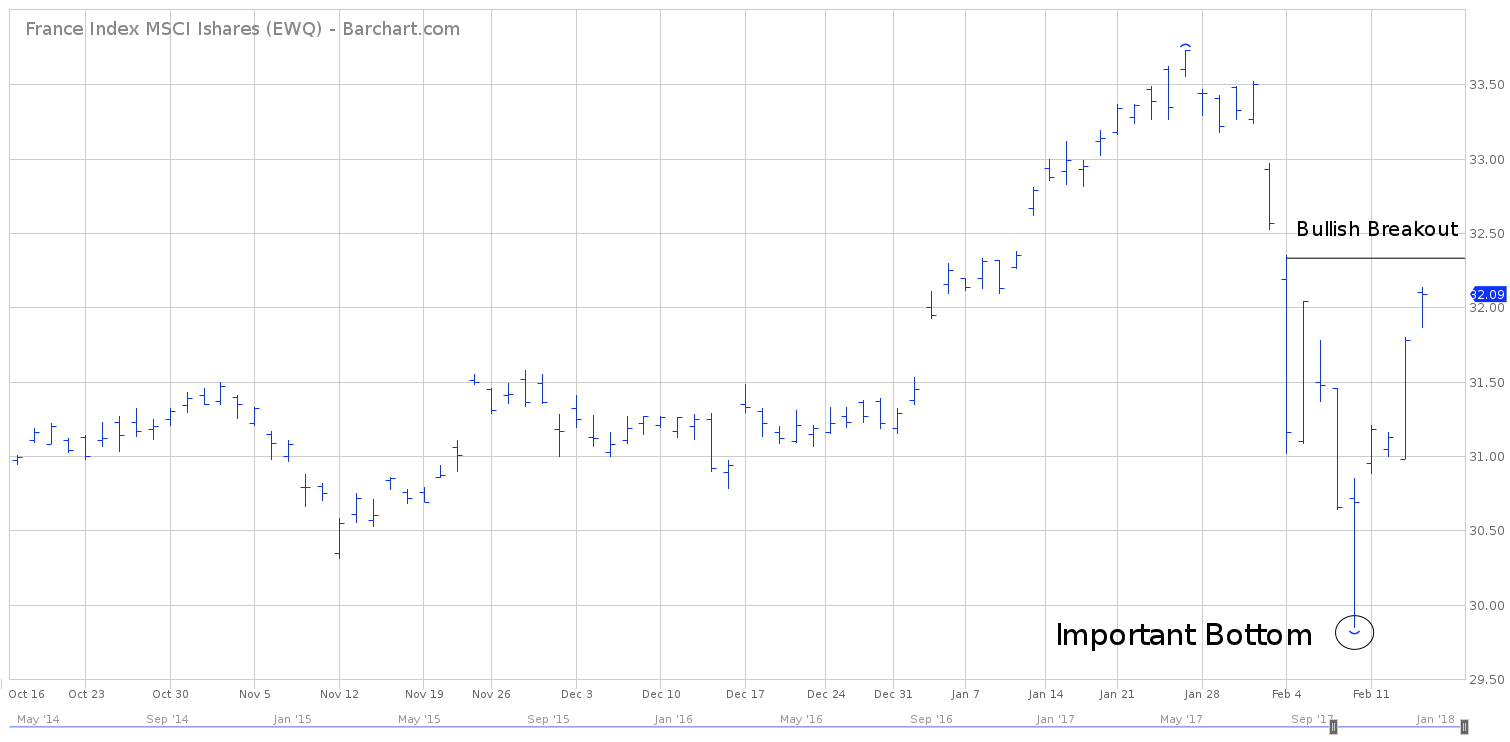
SHORT-TERM CHART – EWQ ETF

Please review the 4-month chart of EWQ. Following the recent sharp decline in the equity market, the short-term chart pattern has turned bearish. The bulls have generated an impressive recovery during the past few trading sessions. However, the chart pattern still remains in favor of the bears. EWQ must produce a weekly close above 32.35 to establish a bullish breakout.
Most likely, an important bottom was formed on February 9th @ 29.84. However, if EWQ is unable to stay above 29.84, the ETF could begin to unravel very quickly. The bulls are in “big trouble” on a weekly close below this number.
LONG-TERM CHART – EWQ ETF
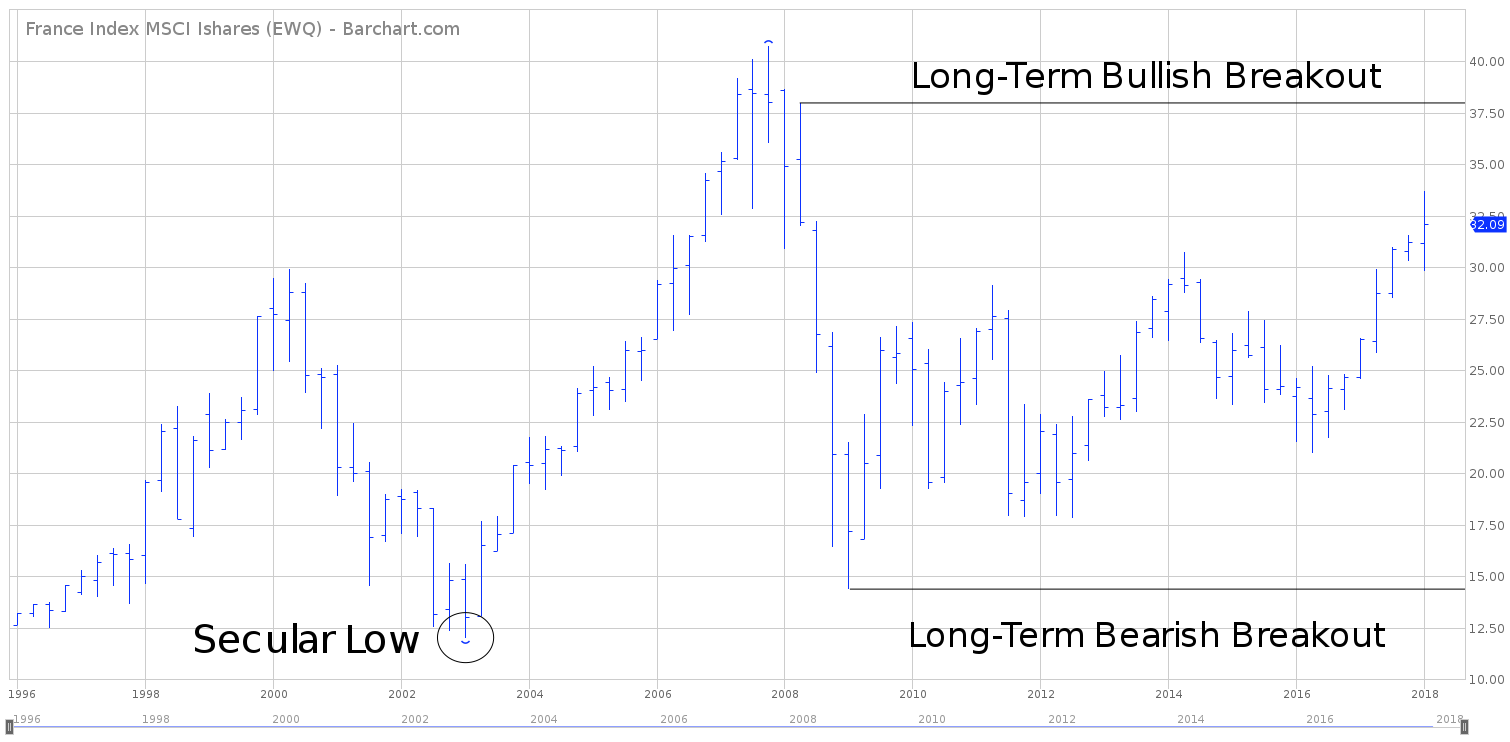
Please review the 22-year chart of EWQ. This chart includes the entire trading history of the ETF. The current chart pattern is neutral. A weekly close above 37.96 will turn the trend bullish. The bears need a weekly close below 14.39 to push the trend in their favor. Most likely, a secular low was formed in March 2003. Therefore, we can expect higher prices well into the 2020s. However, a weekly close below 14.39 would completely change this bullish forecast.
