

iShares MSCI Emerging Markets EFT (EEM)
Key Statistics – EEM Exchange Traded Fund
Minor Support Level 42.72 Minor Resistance Level 48.61
Major Support Level 15.88 Major Resistance Level 52.49
Minor Buy Signal 49.70 Minor Sell Signal 41.24
Major Buy Signal 55.83 Major Sell Signal 12.67
BRIEF OVERVIEW – EEM Exchange Traded Fund
Without question, investments in emerging market (EM) economies can be incredibly volatile and inherently unpredictable. Due to the speculative nature of this investment category, risk adverse investors would do well to completely avoid emerging markets. However, those investors who can tolerate the volatility are often rewarded with outsized returns. Let’s examine emerging market economies in order to determine the possible future direction of this multi-billion dollar investment category.
According to BBVA Research, there are 45 emerging market countries. Please review the following table.
BBVA Research
Emerging Market Countries
Country Country Country Country
Argentina Bahrain Bangladesh Brazil
Bulgaria Chile China Colombia
Czech Republic Egypt Estonia Hungary
India Indonesia Iran Iraq
Jordan Kazakhstan Kuwait Latvia
Lithuania Malaysia Mauritius Mexico
Nigeria Oman Peru Philippines
Poland Qatar Romania Russia
Saudi Arabia Slovakia South Africa South Korea
Sri Lanka Sudan Thailand Tunisia
Turkey United Arab Emirates Ukraine Venezuela
Vietnam
Based on research conducted by BBVA, the fastest growing EM economies are Brazil, China, India, Indonesia, Mexico, Russia and Turkey. In fact, during the next ten years, GDP growth rate for these countries is expected to exceed the average growth rate of all G7 economies (excluding the United States).
In an effort to expose investors to emerging market economies, BlackRock introduced an emerging market ETF through its iShares family of exchange traded funds. The ETF began trading on April 7, 2003, under the ticker symbol EEM. The ETF gives investors access to large and mid-size companies throughout the emerging markets universe. Specifically, EEM consists of 971 different companies. The top three countries within the ETF include China, South Korea and Taiwan.
SHORT-TERM VIEW – EEM Exchange Traded Fund
2018 has not been a good year for EEM. After reaching an important top on January 26th, the ETF has been drifting lower for the past five months, generating a decline of 15.7%. The bears are in complete control of EEM. The next level of support is 42.72, followed by 41.24.
In order to recapture the momentum, the bulls need a weekly close above 50.18. At this point, it seems highly unlikely that the momentum will turn in favor of the bulls any time in the near future. The most likely scenario is a continuation of lower prices.
Based on the Aroon Oscillator, EEM has a moderately oversold reading of -36. The Aroon Oscillator is programmed differently than most stochastic indicators. The oscillator fluctuates between -100 and +100. A reading of 0 would indicate a neutral position. Therefore, a reading of -36 with EEM is considered slightly oversold. Most likely, the ETF is fairly close to generating a short-term rally.
LONG-TERM VIEW – EEM Exchange Traded Fund
As we mentioned earlier, an investment in EM countries is one of the most volatile investment categories. It’s either feast or famine. This volatility is rooted in the fact that emerging market economies are constantly changing. The average duration of an economic cycle for these countries is extremely short in comparison to G7 countries with more mature and diversified economies.
During the financial crisis of 2008, emerging market economies suffered a brutal decline. Consequently, investments linked to emerging markets also endured a viscous decline. However, these investments came roaring back beginning in November 2008. In fact, the emerging market countries recovered much quicker than their G7 counterpart countries.
The past two years have been especially profitable for emerging market investors, with many investors enjoying gains in the neighborhood of 60% to 80%. However, the party came to an abrupt end beginning in February. What happened? What caused the sudden exodus from emerging market economies?
The main culprit is interest rates. Following the financial crisis of 2008, the United States, Japan and Europe dramatically lowered their interest rates in an effort to stimulate economic growth. As a result, the rate of return on fixed income investments and equity investments became rather unattractive. Many investors (particularly institutional investors) began searching for higher yields and better returns. Over the course of the next 12 months, these investors fled the developed countries (US, Japan, Germany, UK, France, Italy, et al.) and made a mad dash to the awaiting arms of the EM countries. They took their investment capital and placed huge bets on Brazil, China, India, Mexico and Russia (just to name a few).
Over the course of the next eight years (2009 – 2017), investors enjoyed healthy rates of return in emerging market debt, equity and currencies. During this same time period, the developed countries continued to push interest rates to all-time historically low levels, with some countries even experimenting with negative interest rates. This dramatic decrease in interest rates simply added more fuel to the fire in regard to investors fleeing developed countries in search for greener pastures among emerging markets.
Of course, all good things must end. Beginning in mid-2017, economic growth began to heat up in North America, Europe and Japan. As a result, stronger growth ushered in rising interest rates, upward revisions to inflation forecasts and stronger currencies. EM investors slowly began to liquidate their enormously profitable positions and began to retreat to the relative safety of the developed countries. The liquidation process began in the 4th quarter of 2017. However, the trend-following crowd didn’t head for the exits until the support levels were violated in February 2018.
History has proven time and again that emerging market investors are a very fickle group. It doesn’t take much for these investors to exit their stock and bond holdings in exchange for a less volatile investment vehicle.
Will the recent decline in emerging market investments turn into a full blown crisis for these economies (similar to the Asian financial crisis of 1997)? Of course, it’s much too early to know for sure. However, the preponderance of the evidence thus far would suggest that the emerging market sell-off is nothing more than a decline in an overbought and overcrowded trade.
In a nutshell, the EM crisis in 1997 was the result of a speculative foreign investment frenzy in Thailand, which ultimately caused a collapse of the local currency. The problems in Thailand quickly spread to Indonesia and South Korea, thus creating the Asian financial crisis. These days, the current economic backdrop in the EM countries is not even remotely similar to the economic landscape of the late 1990s. Therefore, it appears rather unlikely that the current EM decline will morph into a 1997 style crisis.
Although the recent sell-off in emerging market investments has been fairly steep, it’s been a very orderly decline (with no signs of investor panic). At least for now, it appears rather unlikely that another Asian financial crisis is in our future.
In regard to the long-term view of EEM, the ETF remains bullish despite the decline over the course of the past five months. In order to reverse the long-term momentum, the bears need a weekly close below 15.88. It appears highly unlikely the long-term view will turn bearish.
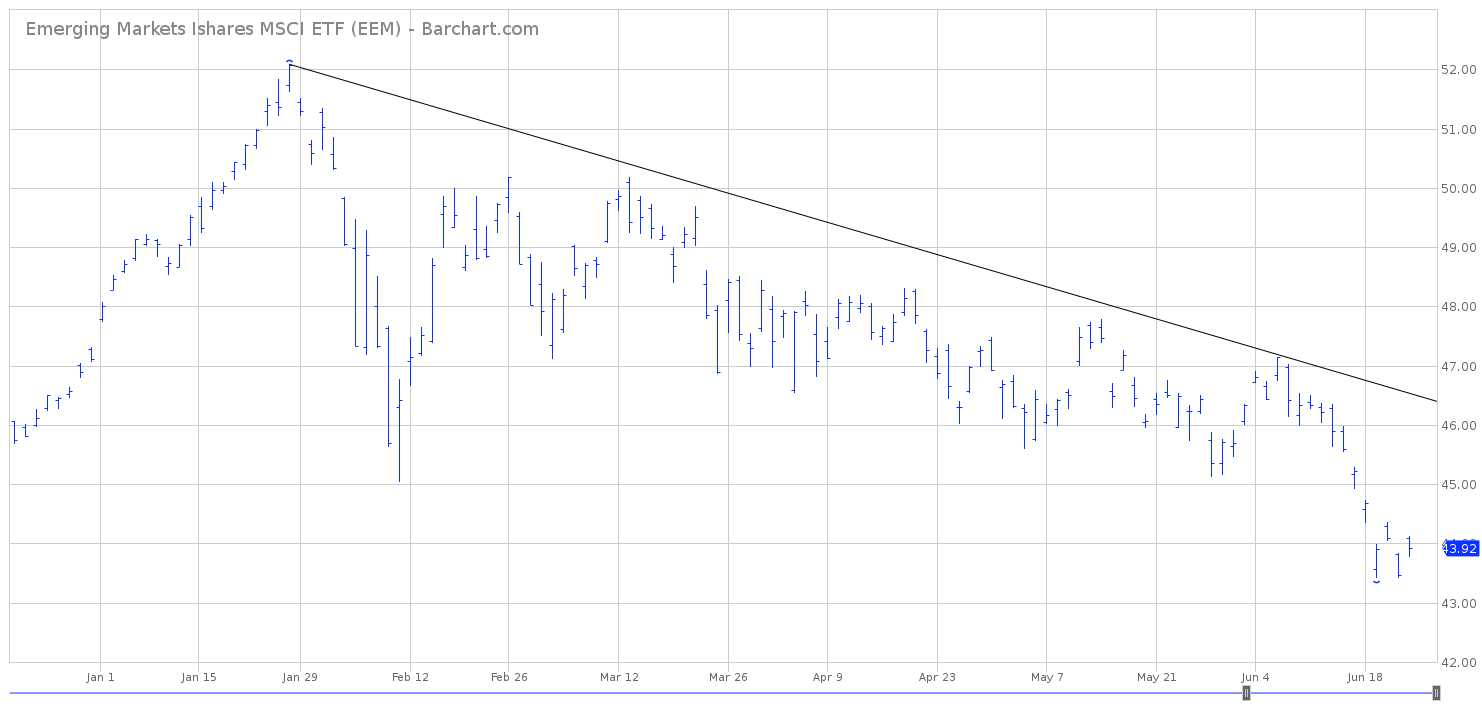
SHORT-TERM CHART – EEM Exchange Traded Fund
Please review the 6-month chart of EEM. The chart pattern certainly looks bearish. The next level of support is 42.72. The chart pattern would turn bullish on a weekly close above 48.61. The bearish trendline is firmly in place.
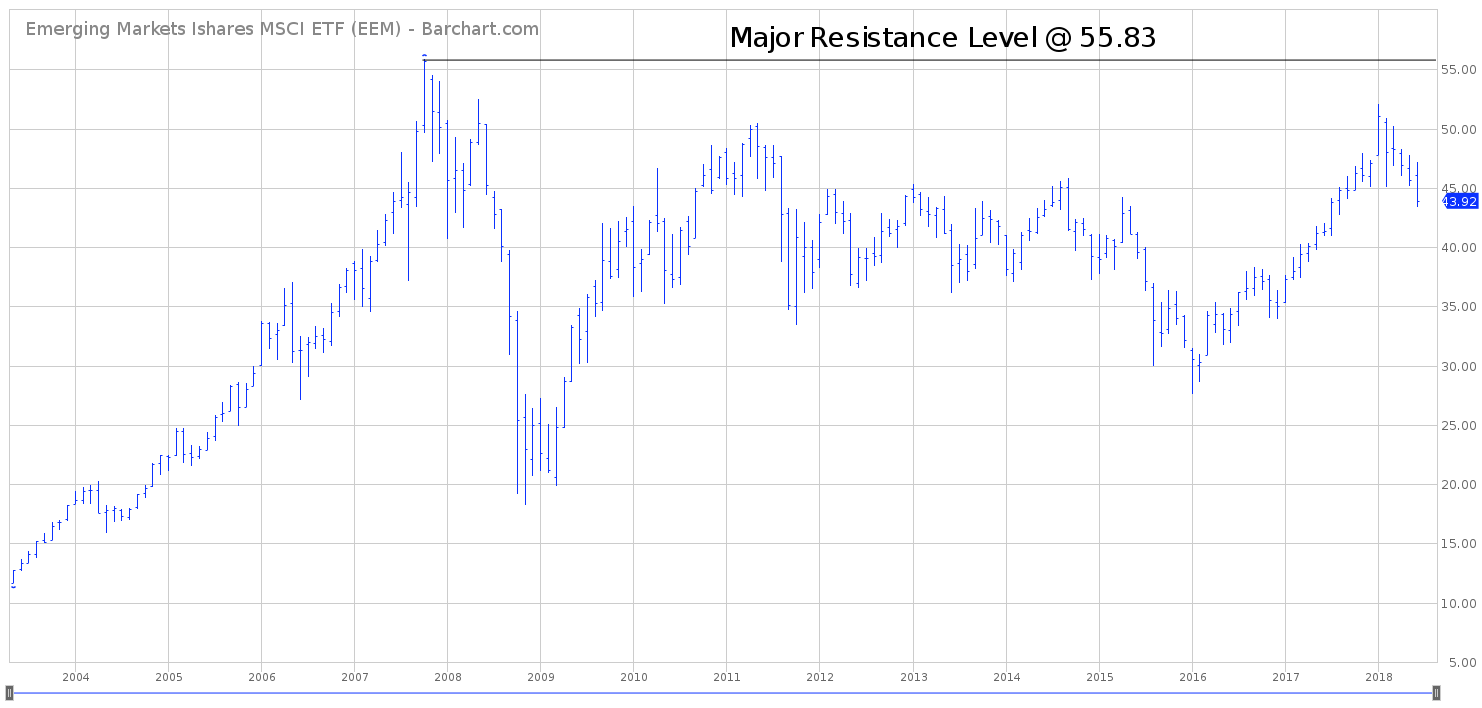
LONG-TERM CHART – EEM Exchange Traded Fund
Please review the 15-year chart of EEM. At first glance, the chart appears to be bullish (based on the fact that EEM successfully penetrated its high from 2011). Additionally, the bulls will argue that EEM was able to easily stay above the 2008 low during its most recent decline in early-2016.
Of course, the bears have a completely different view of the long-term chart. The bears contend that the long-term EEM chart is bearish because the ETF has been unable to exceed its 2007 high of 55.83. As long as EEM stays below 55.83, the bears claim this investment vehicle is headed lower.
Although both camps make a valid argument, it appears the bullish camp has a stronger leg to stand on. Admittedly, it is rather disturbing that EEM has been unable to push above 55.83. The bullish camp has tried unsuccessfully for 11 years to generate a new high. Without question, this is certainly troublesome for the bulls.
Despite the bulls’ inability to penetrate 55.83, EEM has certainly remained in bullish territory far longer than it has remained in bearish territory. Throughout the entire 15-year history of EEM, the trend has been bullish approximately 75% of the time. Therefore, the bulls have the upper hand in terms of the long-term chart pattern. Most likely, 55.83 will be exceeded during the next 12 to 24 months.

