

G-X Uranium ETF: URA
Key Statistics
Minor Support Level 12.45 Minor Resistance Level 15.91
Major Support Level 11.31 Major Resistance Level 87.48
Minor Buy Signal 16.29 Minor Sell Signal 12.06
Major Buy Signal 93.96 Major Sell Signal 10.45
BRIEF OVERVIEW – Uranium ETF URA
Uranium is the fuel used to operate nuclear power plants. Without question, it is the most hated and despised commodity on the planet. It has been the source of many tragic accidents and human suffering over the years. The most catastrophic accident involving uranium was the Chernobyl nuclear accident in April 1986. In terms of cost and human casualties, it was the most disastrous nuclear power plant accident in history.
Despite our disdain for uranium (because of its link to nuclear accidents), this commodity helps provide the world with enormous amounts of clean, safe, emission-free electric power. Coal, which is also used to generate electricity, has killed far more people than uranium. However, coal isn’t synonymous with nuclear energy. Therefore, it never receives the amount of negative press coverage in comparison to uranium.
Nuclear energy plays a vital role in our nation’s economy. In fact, 20% of America’s electricity comes from nuclear energy. Over 20 million homes in the United States receive electricity on a daily basis thanks to nuclear power. Without this source of energy, 20% of the American population would live in the dark.
The Global X family of exchange traded funds introduced the G-X Uranium ETF in November 2010, using the ticker symbol URA. This ETF provides investors with access to the world’s largest publicly traded uranium mining companies. Specifically, the URA portfolio consists of 21 different holdings. The top five holdings include Cameco Corp, NexGen Energy Ltd, Uranium Participation Corp, Berkeley Energia Ltd and Fission Uranium Corp.
SHORT-TERM VIEW Uranium ETF – URA
URA has been drifting lower for the past three months. The short-term momentum favors the bearish camp. The next level of support is 12.45. During the past three months, the bulls have made three attempts to produce a sustainable rally. However, each rally has been met with heavily selling pressure. In order to recapture the upside momentum, the bulls need a weekly close above 15.91.
Based on the Aroon Oscillator, URA has a moderately oversold reading of -24. The Aroon Oscillator is programmed differently than most stochastic indicators. The oscillator fluctuates between -100 and +100. A reading of 0 would indicate a neutral position. Therefore, a reading of -24 with URA is considered moderately oversold. Most likely, the ETF is fairly close to a short-term bottom.
LONG-TERM VIEW Uranium ETF – URA
In 2008, uranium generated an all-time high of $135 per lb. The price has been drifting lower for the past ten years, particularly since 2011, following the Fukushima nuclear disaster in Japan. On March 15, 2011, Japan suffered one of its worst earthquakes in recorded history. The earthquake along with the resulting tsunami, caused a nuclear meltdown at the Fukushima nuclear power plant.
In 2011 (prior to the Fukushima disaster), uranium was near $70 per lb. Today, the price is slightly above $20 per lb, trading near its lowest level in 13 years. In response to Japan’s nuclear accident, several countries immediately began to reevaluate their energy programs, particularly in regard to nuclear energy. A few countries completely eliminated their nuclear energy programs, which dramatically reduced the demand for uranium. Shortly after the Fukushima event, Japan dumped all of its above-ground uranium supplies onto the market. Of course, this created a huge oversupply problem in the uranium market; a problem that still exists today.
Cameco is the world’s largest public uranium miner. In November 2017, the company announced it was dramatically reducing its uranium output for the next few years, as the price of uranium at the wholesale level is actually below Cameco’s cost of production. Most likely, the market is very close to its final bottom. When the world’s largest producer of uranium can’t generate a profit, this is a “tell-tale sign” that the bottom is near.
It’s completely impossible for nuclear energy to disappear. The global economy simply doesn’t have enough alternative resources to act as a substitute for nuclear power. In fact, based on the incredibly low cost of uranium, many countries will probably increase their nuclear energy programs during the next few years.
Most likely, $20 per lb marked the final low in uranium. The price could easily double within the next 24 months. Eventually, the price of uranium will return to the levels of 2011, prior to Japan’s nuclear accident.
For those investors who like contrarian plays, uranium is a perfect candidate. It meets all of the qualifications of a contrarian play; it is trading near a multi-year low, it is despised by the general public, the investment community has absolutely no interest in participating, there is very little coverage on Wall Street and the firms within the industry are unable to generate a profit. Uranium could be the contrarian investment of the decade.
Unfortunately, Global X was extremely unlucky when it launched URA in November 2010. Four months after the ETF began trading, the Fukushima nuclear accident occurred. The price of uranium collapsed immediately following the nuclear disaster. Essentially, URA has been grinding its way lower since March 2011.
The long-term momentum has been in favor of the bears for seven grueling years. The next level of support is 11.31. In order to capture the upside momentum, the bulls need a weekly close above 87.48 (highly unlikely any time soon).
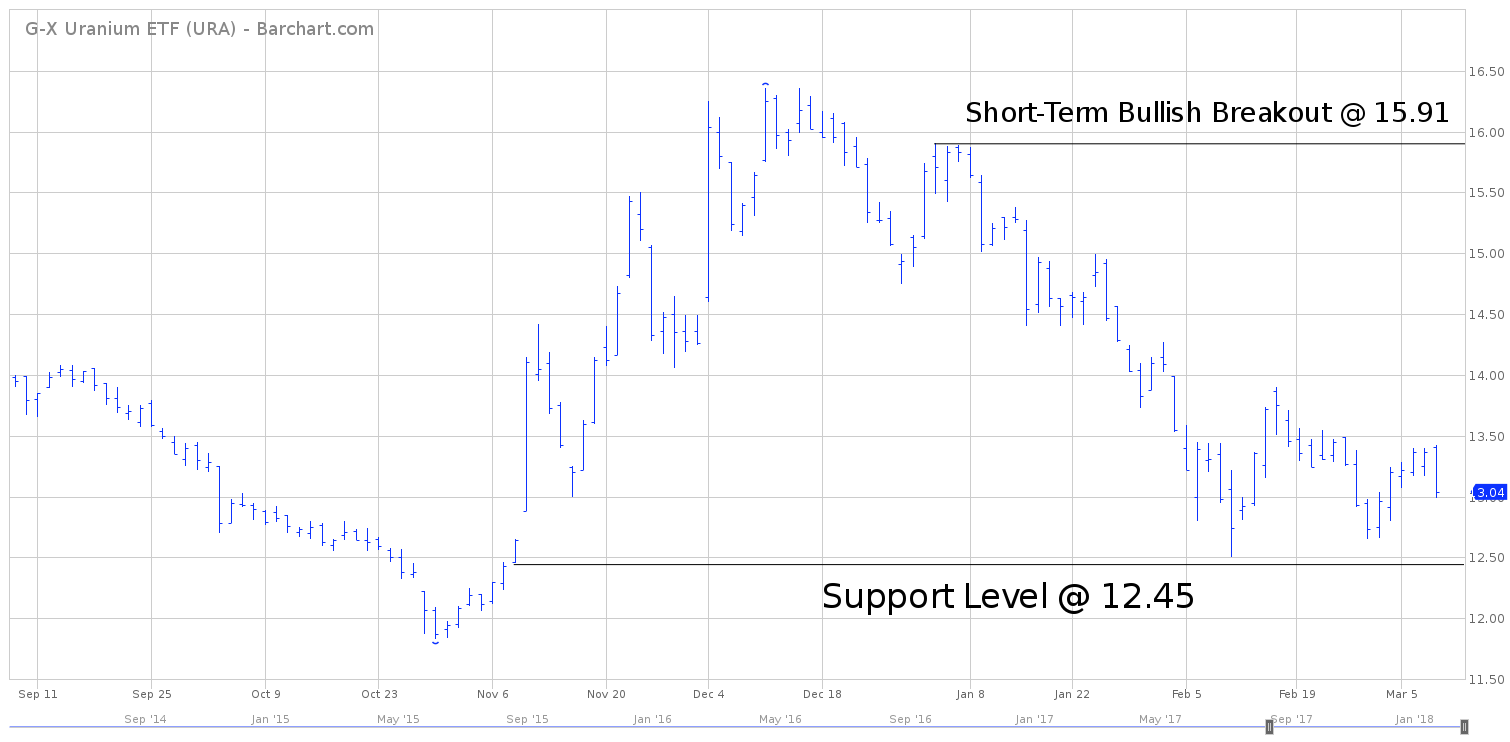
SHORT-TERM CHART Uranium ETF – URA

Please review the 6-month chart of URA. The bulls were able to generate a decent rally during the final two months of 2017. However, the rally was unsustainable. URA has been pushing its way lower for the past 90 days. The short-term chart pattern remains bearish. The next level of support 12.45. A weekly close below 12.45 opens the door to the 2017 low @ 11.83.
A weekly close above 15.91 will turn the chart pattern in favor of the bulls. However, at least for now, the short-term trend remains quite bearish. The bulls are in big trouble if URA produces a weekly close below 11.83.
LONG-TERM CHART Uranium ETF – URA
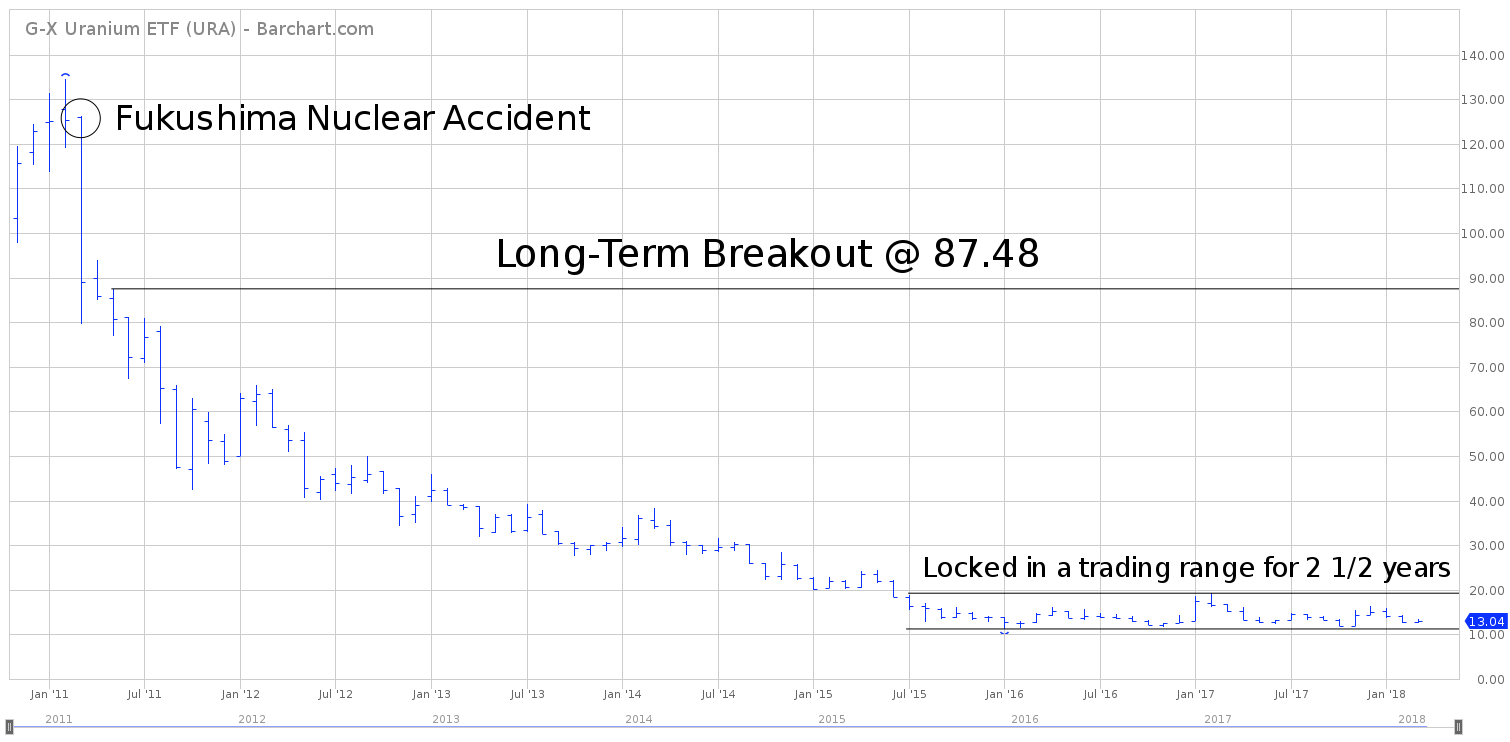
The long-term chart contains the entire trading history of URA, dating back to November 2010.
URA has been struggling to regain its footing since March 15, 2011, which marks the date of Japan’s massive earthquake and subsequent nuclear accident. Obviously, the bears are in complete control of URA. The next level of support is the all-time low @ 11.31.
URA has been trading sideways for the past 2 ½ years. A weekly close above 19.33 would give the bulls a small glimmer of hope. However, the true long-term breakout won’t occur until URA exceeds 87.48 on a weekly closing basis.
