Invesco CurrencyShares Japanese Yen Trust (FXY)
Key Statistics – FXY ETF Japanese Yen Trust
Minor Support Level 83.78 Minor Resistance Level 89.13
Major Support Level 79.92 Major Resistance Level 120.03
Minor Buy Signal 90.22 Minor Sell Signal 82.53
Major Buy Signal 123.76 Major Sell Signal 77.19
BRIEF OVERVIEW – FXY ETF Japanese Yen Trust
Arguably, the Japanese Yen receives more bearish price forecasts than any other G20 currency on the global foreign exchange market. The Yen has been “left for dead” countless times during the past 20 years. However, the currency continues to baffle the forex professionals by continuing to maintain price stability and market share on the global stage. Why do currency traders “love to hate” the Japanese Yen and will the currency ever collapse, as many economists have been predicting for the past two decades? Let’s examine the details.
The Yen became Japan’s official currency in 1871, when the Japanese government passed the New Currency Act of 1871. In order to maintain price stability, the Bank of Japan was founded in 1882. In order to provide an historical frame of reference, the US Dollar became the country’s official currency in 1792. The Federal Reserve was formed in 1913.
Despite the Yen’s reputation as a volatile currency, it has maintained a relatively stable trading range since World War II. During the past few decades, global central banks and G20 nations have increased their exposure to the Yen. Currently, the currency is ranked third in terms of foreign reserve holdings by central banks. In terms of spot trading on the global forex market, only the US Dollar and Euro generate more daily volume.
The Invesco family of exchange traded funds introduced the CurrencyShares Japanese Yen Trust on 12 February 2007, using the ticker symbol FXY. As the name implies, FXY is not an exchange traded fund as defined by the Investment Company Act of 1940. Instead, it was established as a grantor trust, with the Bank of New York Mellon acting as the trustee of the trust. JPMorgan Chase Bank, N.A. is the depository of the trust. Although FXY is not legally registered as an exchange traded fund, it trades in exactly the same manner as an ETF. As far as investors are concerned, there is no difference between a grantor trust and an ETF. FXY is a great way for investors to gain exposure to the Japanese Yen without incurring the volatility of the forex markets.
SHORT-TERM VIEW – FXY ETF Japanese Yen Trust
In regard to the short-term view of FXY, the bulls recaptured the momentum on 4 January, by generating a weekly close above 86.88. The next important resistance level is 89.13. In order to regain the upper hand, the bears need a weekly close below 83.78. For now, the path of least resistance is to the upside.
Based on the Aroon Oscillator, FXY has a fairly neutral reading of +36. The Aroon Oscillator is programmed differently than most stochastic indicators. The oscillator fluctuates between
-100 and +100. A reading of 0 would indicate a neutral position. Therefore, a reading of +36 with FXY is considered rather neutral. Most likely, the trust will continue to trade sideways during the next few weeks.
LONG-TERM VIEW – FXY ETF Japanese Yen Trust
It’s not uncommon to find currency traders on Wall Street who have spent their entire careers maintaining a bearish view on the Japanese Yen. During the past two decades, some of the greatest forex traders in the world have lost a considerable amount of money shorting the Yen. Financial markets are designed to frustrate as many people as possible. The Japanese Yen has certainly frustrated many currency speculators over the years. Why do forex professionals continue to remain bearish on the Yen? Let’s analyze the data.
Debt-to-GDP Ratio
2009 – 2017
Year Japan USA Germany Canada France
2009 210.2 82.4 72.6 79.3 78.9
2010 215.8 91.4 81.0 81.1 81.6
2011 231.6 96.0 78.7 81.5 85.2
2012 238.0 100.1 79.9 84.8 89.5
2013 244.5 101.2 77.5 85.8 92.3
2014 249.1 103.2 74.5 85.4 94.9
2015 248.0 100.8 70.8 91.6 95.6
2016 250.4 105.8 67.9 92.4 96.6
2017 253.0 105.4 63.9 89.6 97.0
Source Trading Economics | All numbers are displayed in % terms.
This table explains why currency traders have been chronically bearish on the Japanese Yen for the past 20 years. Japan’s debt-to-GDP ratio is completely out of control. It has been steadily increasing since the late 1990s. In 2017, the country’s debt was 253% of its gross domestic product (GDP). In other words, Japan debt is 253% greater than all of the goods and services produced by the country. This number is absolutely staggering. In comparison to other countries, Japan is an “accident waiting to happen.”
Logic would seem to dictate that the global foreign currency markets would not allow Japan to carry such an enormous debt burden. Most experts would conclude that the Japanese Yen would become massively devalued against other global currencies.
For the past 40 to 50 years, all major foreign currencies have evolved into fiat currencies. For example, the US Dollar officially became a fiat currency when President Nixon cancelled the convertibility of the Dollar to gold on August 15, 1971. The US Dollar lost all intrinsic value and immediately became fiat money.
The Japanese Yen is also fiat money. Therefore, it has absolutely no intrinsic value. The currency is simply backed by the “full faith and credit” of the Japanese government. For the past two decades, forex speculators have been betting that the global investment community would lose its faith in the Yen. So far, the speculators have been 100% wrong. The Japanese currency continues to remain quite stable and fairly valued against other G20 currencies.
Why has the Japanese Yen been able to defy logic for the past 20 to 25 years? Why hasn’t the yen completely collapsed? Because the citizens of Japan are incredibly loyal and patriotic. For the past 50 years, the Japanese government has encouraged its citizens to save their money. Over the years, the government has introduced special incentives to promote domestic savings. Additionally, the Japanese government uses effective advertising campaigns which highlight the benefits of saving for the future. The government equates domestic savings with patriotism. These advertising campaigns and special savings programs have been highly effective during the past several decades. Japan has one of the highest domestic savings rates among all G20 countries.
Domestic Savings Rate
1970 – 2017
Year Japan USA Germany Canada France
1970 42.20 21.73 27.91 23.62 28.74
1980 32.98 22.81 20.06 25.16 24.21
1990 35.29 20.17 24.34 21.64 23.62
2000 28.74 19.91 24.19 26.39 23.82
2010 22.76 14.97 24.82 21.54 20.66
2017 26.20 16.80 25.70 21.70 14.20
Source The World Bank | All numbers are displayed in % terms.
As you can see, Japan’s domestic savings rate was incredibly high throughout the 1970s, 1980s and 1990s. Admittedly, the savings rate has declined during the past 17 years. However, the decline since 2000 can be blamed on demographics. Beginning in the late 1990s, the country had to deal with an aging population. To make matters worse, as the population began to age, Japan experienced an abnormal period of declining birth rates. These two demographic factors caused the country’s domestic savings rate to fall rather sharply throughout the first 15 years of the 2000s. However, the demographic problem has subsided during the past few years. Not surprisingly, Japan’s domestic savings rate is beginning to move higher once again.
As long as Japan continues to maintain a relatively high savings rate, the country can easily manage to carry a high debt-to-GDP ratio. Essentially, Japan is financing its own debt through domestic savings. Japan’s central bank (BOJ) does not rely on foreign investors to purchase JGB government bonds. Instead, individual Japanese investors purchase the bonds through a network of government-sponsored bond purchase programs. At least for now, there’s no reason to believe that the country’s savings rate will decline. In fact, it appears that the savings rate will move higher for the next several years based on improving demographics.
In addition to its high savings rate, Japan enjoys a very healthy balance of payments (BOP) surplus. Essentially, the country exports more goods and services than it imports. A BOP surplus eases the burden of a high debt-to-GDP ratio.
Arguably, the most important reason why the Yen hasn’t collapsed is because everyone is forecasting a collapse. As long as most currency traders continue to remain bearish, the Japanese Yen will remain relatively stable.
As a side note; Why have the financial markets allowed the United States to maintain such a high debt-to-GDP ratio along with a very low domestic savings rate? Because the US Dollar is the official global reserve currency. Other countries are basically forced to use the Dollar in all international transactions. Consequently, this allows the US government to carry a high ratio of debt-to-GDP. The US economy will be in “big trouble” if the country ever loses its currency reserve status.
Please review the attached 30-year chart of the Japanese Yen (Chart #1). The currency enjoyed a spectacular rally from 2007 through 2011, culminating with a new all-time high in Q4 2011. During the past seven years, the Yen has been drifting lower. However, the decline has been very stable and rather subdued. Currently, the Yen is trading right in the middle of its 30-year trading range. A “collapse” of the Japanese Yen is highly unlikely any time in the foreseeable future. The future looks bright in the land of the rising sun!
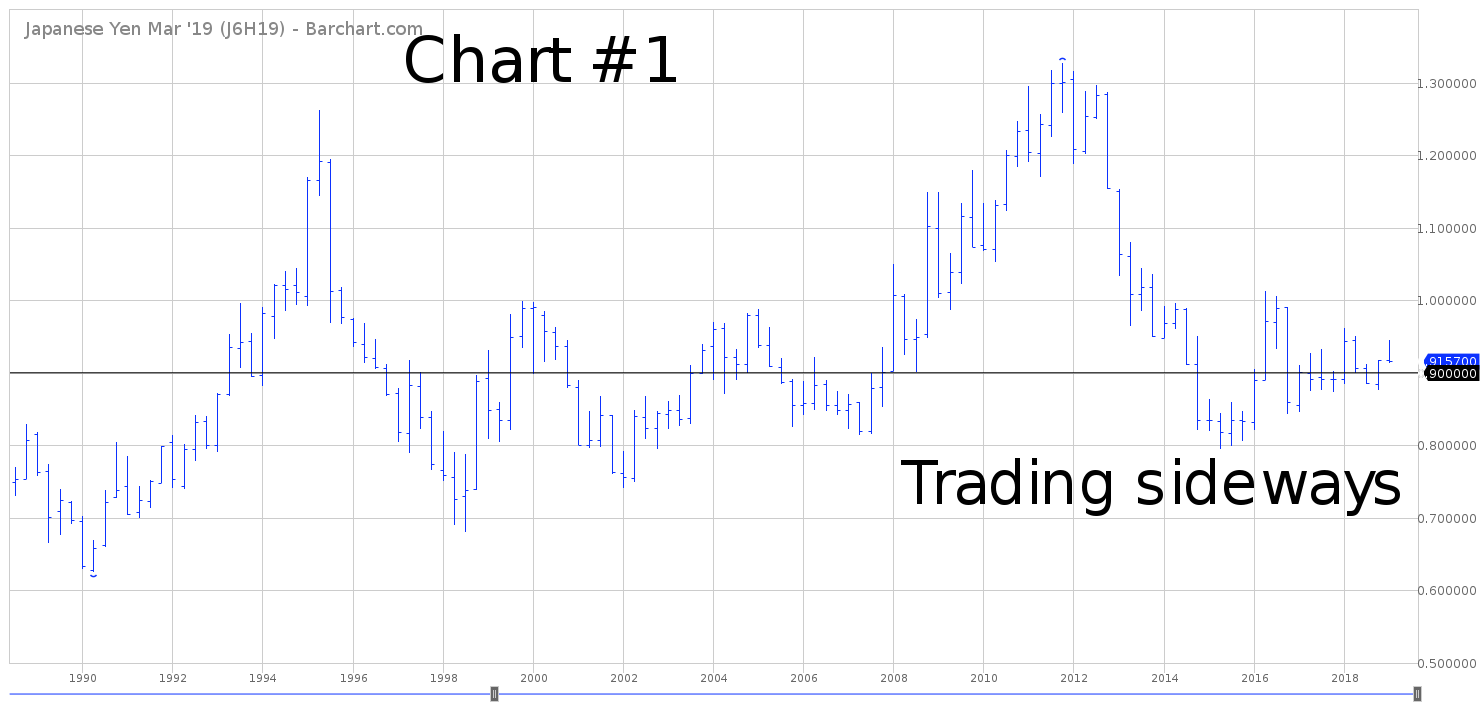
In regard to the long-term view of FXY, the momentum is in favor of the bears. However, the trust has only been in existence for 12 years. In the world of foreign currencies, 12 years is a fairly short period of time. In order to reclaim the momentum, the bulls need a weekly close above 120.03.
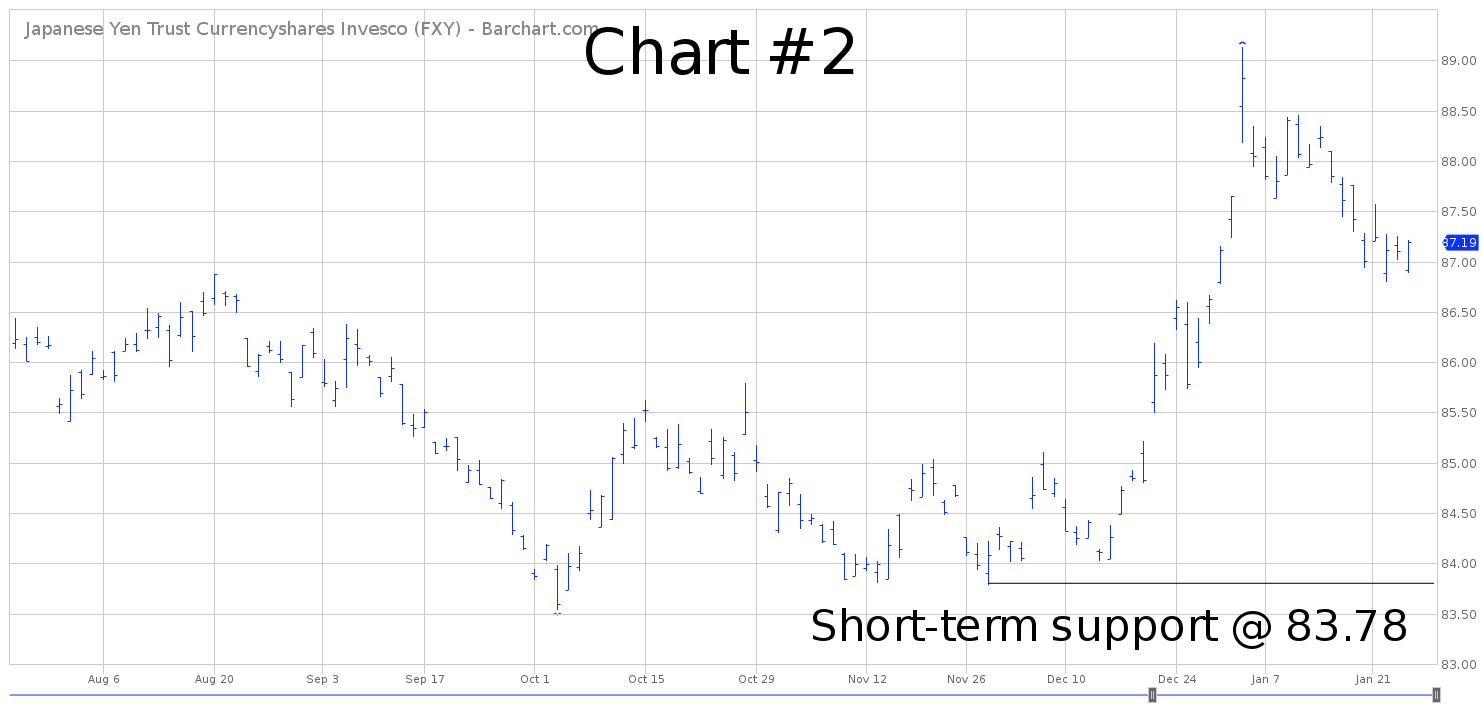
SHORT-TERM CHART – FXY ETF Japanese Yen Trust
Please review the 6-month chart of FXY (Chart #2). The short-term chart pattern is in favor of the bulls. The next breakout level is 89.13. The bears need a weekly close below 83.78 to recapture the trend. The most likely scenario is a continuation of the bullish trend.
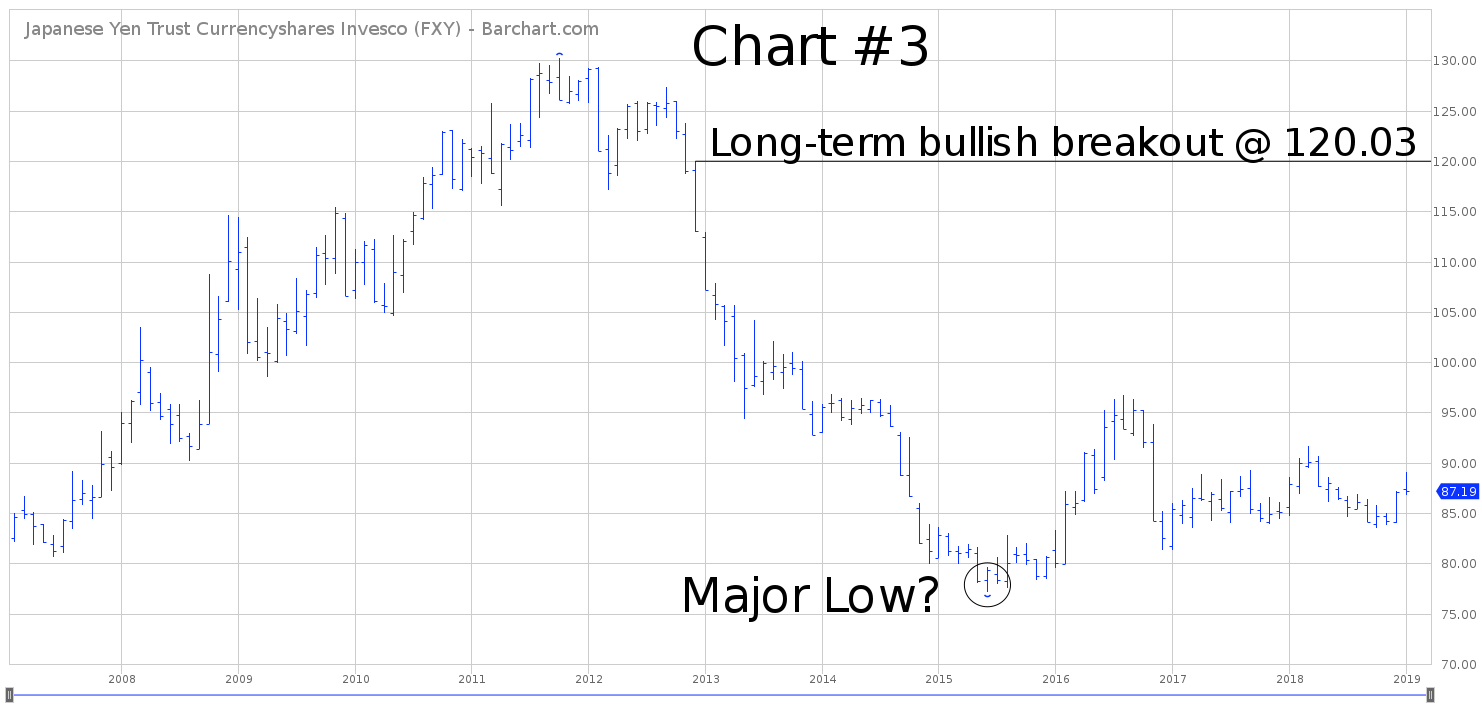
LONG-TERM CHART – FXY ETF Japanese Yen Trust
Please review the 12-year chart of FXY (Chart #3). This chart covers the entire trading history of the trust. After generating an all-time high in October 2011, FXY fell rather sharply for the next four years. Most likely, the trust created an important bottom in July 2015 @ 77.19. In order to recapture the long-term trend, the bulls need a weekly close above 120.03.