DB Commodity Index PowerShares ETF (DBC) – Special ETF Report
Key Statistics
Short-Term Trend Bullish
Intermediate-Term Trend Bullish
Long-Term Trend Bullish
Minor Support Level 14.15 Minor Resistance Level 15.68
Major Support Level 12.10 Major Resistance Level 25.43
Minor Buy Signal 15.74 Minor Sell Signal 13.98
Major Buy Signal 26.53 Major Sell Signal 11.70
SHORT-TERM VIEW
Based on the price action in DBC during the past few months, it appears the commodity universe could be in the very early stages of a sustainable rally. Of course, it’s much too early to make a bold forecast of a new long-term commodity bull market. DBC must continue to push its way higher before we can safely conclude that a new bull market is underway in the commodity space.
At least for now, the bulls have recaptured the upside momentum. All three of the trend indicators have moved into bullish territory. In order to generate a more sustainable breakout, the bulls need a weekly close above 15.68. If the bears want to reestablish the upper hand, they must push DBC below 14.15 on a weekly closing basis.
Even though DBC has enjoyed a healthy rally during the past three months, the market has not advanced into overbought territory. The current stochastics reading is in a fairly neutral position. Therefore, the market could easily generate another leg to the upside before it becomes overbought.
LONG-TERM VIEW
Despite the recent advance, the long-term view of DBC is unquestionably bearish. The market formed a massive top in July 2008. Over the course of the next 7 ½ years, DBC drifted relentlessly lower. There have been a few rally attempts during the past seven years. However, each feeble rally was met with heavy selling pressure. The selling pressure may have reached its final climax in January 2016, when DBC recorded an all-time low of 11.70. However, despite the healthy rally during the past 18 months, it’s still much too early to conclude that January 2016 was indeed the final bottom of this brutal bear market.
The bears are comfortably in control of DBC from a long-term perspective. The bulls need a monthly close above 25.43 in order to regain control of the longer term narrative. In terms of percentages, DBC must increase 64% to change the trend from bearish to bullish. Therefore, at least for the next several months, the bears definitely have the upper hand in regards to the “big picture” trend.
Of course, the price of DBC is heavily influenced by the commodity markets. However, each sector of the commodity universe is not equally represented within the DBC ETF. The following table displays the individual weighting of each commodity in the DB Commodity Index ETF.
Major Components of DB Commodity Index
Commodity Commodity Sector Weighting
Gasoline Energy 13.52%
Brent Crude Oil Energy 12.86%
NY Harbour ULSD Energy 12.85%
WTI Crude Oil Energy 12.31%
Gold Precious Metals 7.59%
Zinc Base Metals 5.34%
Natural Gas Energy 5.28%
Soybeans Grains 5.21%
Copper Base Metals 4.99%
Aluminum Base Metals 4.92%
Corn Grains 4.90%
Wheat Grains 4.87%
Sugar Softs 3.64%
Silver Precious Metals 1.71%
Clearly, the energy sector comprises the largest holding within DBC. If fact, the weighting of the energy sector is 56.82%. Therefore, the price movement of crude oil, gasoline and heating oil exert the greatest influence on DBC. Consequently, it should come as no big surprise that crude oil reached its peak in June 2008, right in line with DBC. Although crude oil and DBC do not always move in perfect harmony, these markets are highly correlated.
Where do we go from here? Is the commodity universe in the early stages of a new multi-year bull market? As we discussed a few minutes ago, it’s still premature to conclude that DBC formed a secular low in January 2016. At the very least, the market must successfully penetrate the 25.43 level on a monthly closing basis. A monthly close above 25.43 opens the door to sharply higher prices over the course of the next several years.
Based purely on long-term cycles, a successful argument could be made that we have been in a secular commodity bull market since the turn of the century in 2000. The vast majority of individual commodities formed multi-year lows between 1999 & 2001. These lows have never been penetrated, even during the great recession of 2008-09. Based on this analysis, 2016 probably marked a cyclical low within a long-term secular commodity bull market. If this analysis is correct, the price of DBC is headed dramatically higher during the next 3 to 5 years.
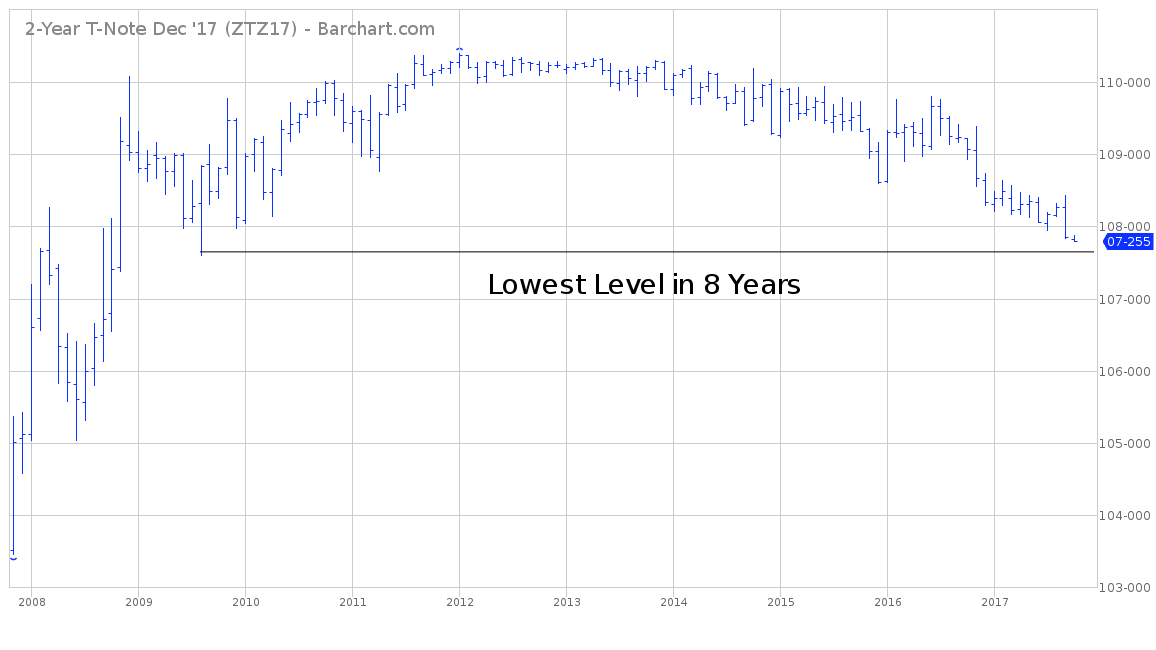
Another clue which tells us that commodities are in a new bullish phase, can be found in the chart of the 2yr Treasury Note. T-Note prices are hovering near their lowest level in eight years. Treasury prices move in the opposite direction of interest rates. Therefore, the rate on 2yr T-Notes is trading at its highest level since August 2009. Traders are pushing Treasury rates higher in anticipation of increased levels of inflation over the course of the next several years. Rising commodity prices go hand in hand with rising inflation. This explains the brutal decline in 2yr Treasury Notes, as traders prepare for a resurgence in commodity prices.
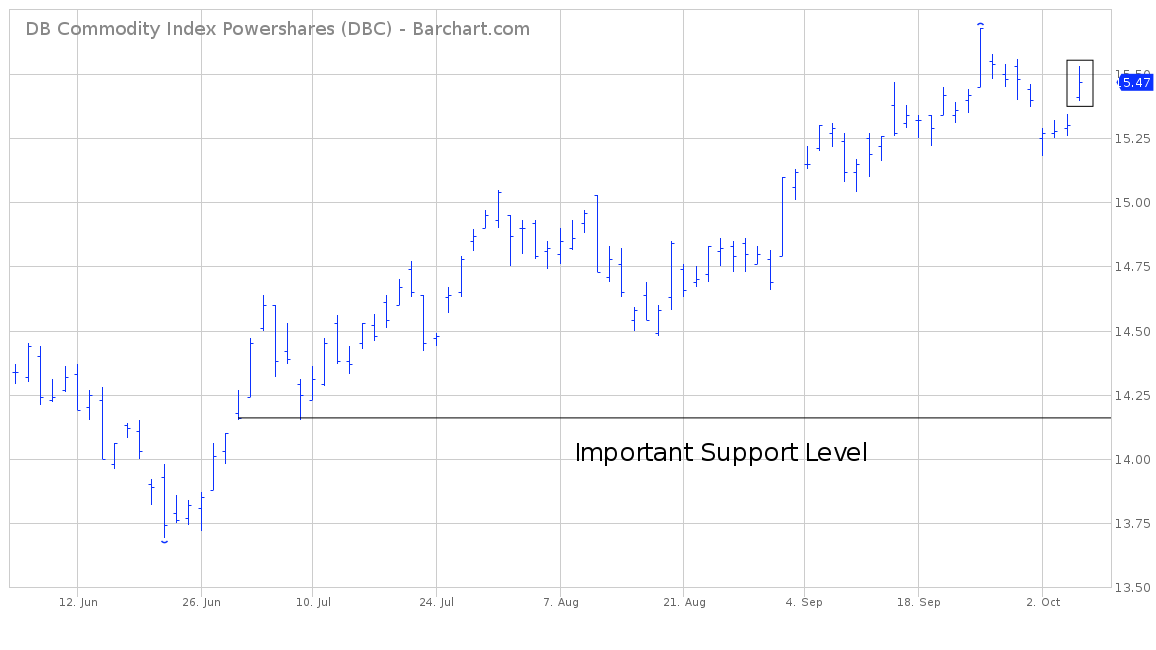
SHORT-TERM CHART
Please review the attached 4-month chart of DBC. The bulls are in control of the short-term trend as long as DBC stays above 14.15 (horizontal line). As you can see, the market produced a bullish “breakaway gap” on Oct 5th. This could mark the beginning of a sustainable move to the upside. A weekly close above 15.68 opens the door to higher prices.
LONG-TERM CHART
Attached, you will find a 10-year chart of DBC. Based on the long-term chart pattern, DBC is still clearly in a bear market (which officially began in July 2008). An argument could be made that DBC formed an important bottom in January 2016 @ 11.70. However, the bulls need a close above 47.53 to confirm January 2016 as a long-term bottom (horizontal line).

2YR T-NOTE CHART
Please review the attached 10-year chart 2yr T-Notes. The market is trading near its lowest level in eight years (horizontal line). Without question, the bears are in complete control of 2yr T-Notes. Interest rates have been slowly grinding their way higher since mid-2009. The price action in 2yr Treasury Notes is an indication that traders expect increased rates of inflation for the next few years (or longer). The 2yr T-Note chart is the “canary in the coal mine,” signaling the beginning of rising inflation along with rising commodity prices.