

iShares China Large-Cap ETF (FXI)
Key Statistics
Minor Support Level 39.13 Minor Resistance Level 44.21
Major Support Level 28.27 Major Resistance Level 60.02
Minor Buy Signal 45.29 Minor Sell Signal 37.66
Major Buy Signal 65.93 Major Sell Signal 22.69
BRIEF OVERVIEW – FXI China Large Cap ETF
Arguably, the most powerful economy in the industrialized world belongs to China. During the past 30 years, the country’s economic growth rate has dramatically outperformed all other G20 countries. However, China has not always enjoyed a strong economy. In fact, in the 1940s, 1950s and 1960s, China was considered one of the poorest countries on earth. During this time period, peasant farmers occupied the vast majority of the Chinese landscape. The farmers operated within the confines of an economic backdrop based on a central planning model. Unfortunately, the central planning model created a great deal of inefficiencies in Chinese agriculture.
In 1978, China’s central government decided to move in a radically different direction. They developed a series of five-year plans to increase productivity, income levels and standards of living. Initially, the five-year plans only included the country’s agriculture sector. However, upon experiencing such tremendous success in agriculture, China added clothing, footwear, mass merchandise, pharmaceuticals, computers and automobiles to its economic plan. By the mid-1980s, the country’s per capita GDP had exploded to the upside. In addition to per capita GDP, China also enjoyed a dramatic increase in its current account. For those of you who may not be familiar with current account, it simply measures balance of trade with other countries. Thanks to the success of its five-year plan, China had a current account surplus. In other words, the country was selling a tremendous amount of its goods and services abroad to other countries. Between 1982 and 2004, China’s surplus grew twelve-fold from $5.7 billion to $71 billion. In less than 30 years, China went from a poor developing country to one of the most powerful economies on the planet.
China Per Capita GDP
1980 – 2018
Year Amount Year Amount Year Amount
1980 347.12 1981 360.42 1982 386.89
1983 422.66 1984 480.30 1985 537.50
1986 576.91 1987 634.09 1988 694.06
1989 712.11 1990 729.16 1991 786.13
1992 886.95 1993 998.40 1994 1,116.03
1995 1,224.85 1996 1,332.42 1997 1,440.59
1998 1,538.66 1999 1,642.36 2000 1,767.83
2001 1,901.41 2002 2,061.16 2003 2,253.93
2004 2,467.13 2005 2,732.17 2006 3,062.53
2007 3,480.15 2008 3,796.63 2009 4,132.90
2010 4,550.45 2011 4,961.23 2012 5,325.16
2013 5,710.59 2014 6,096.49 2015 6,484.43
2016 6,883.90 2017 7,308.06 2018 7,752.56
Source St Louis Federal Reserve | US Dollars
As you can see from the table, China’s per capita GDP has risen exponentially during the past four decades. Since 1980, the number has advanced 2,134%. This is an unprecedented rate of growth. During the past century, no other country has been able to match China’s domestic economic growth rate. Not even close. It’s highly unlikely that this level of per capita GDP will ever be matched by another country.
The explosive growth of China’s economy during the past four decades makes a compelling argument in favor of capitalism over socialism or communism. It’s very difficult to ignore the unprecedented growth rate of the Chinese economy throughout the 1980s, 1990s and 2000s. As we briefly mentioned, the explosion of economic growth began when China implemented economic policies that mirrored a free market structure in lieu of a centrally planned regime. Of course, there is no denying the fact that many aspects of life in China are still tightly controlled by the government. However, in regard to economic policies, government leaders have allowed businesses and consumers to operate in a market based environment. During the past 40 years, the results have certainly exceeded expectations.
The iShares family of exchange traded funds (distributed by BlackRock Investments LLC) introduced the China Large-Cap ETF on 5 October 2004. The ticker symbol is FXI. This ETF is a perfect vehicle for investors who wish to participate in Chinese equities with a large market capitalization. In other words, FXI is comprised of the largest Chinese companies traded on a regulated stock exchange. The ETF contains 50 different stocks. The top five holdings include Tencent Holdings Ltd, Chinese Construction Bank, Ping An Insurance Company, Industrial and Commercial Bank of China and Meituan Dianping. Approximately 50% of the entire ETF consists of companies from the financial services industry. FXI is a very popular ETF, with an average daily volume of approximately 50 million shares.
SHORT-TERM VIEW – FXI
The recent outbreak of coronavirus within several Chinese provinces has placed downward pressure on all equity markets within China. Consequently, the bears have recaptured the short-term momentum of FXI. The next level of support is 39.13. In order to recapture the short-term momentum, the bulls need a weekly close above 44.21.
LONG-TERM VIEW – FXI
China is a perfect example of what can happen when a group of government leaders are willing to implement radical changes in terms of domestic economic policies. Please examine the following tables.

China GDP Rate of Change
1980 – 2018
Year Amount Year Amount Year Amount
1980 7.9% 1981 5.1% 1982 9.0%
1983 10.8% 1984 15.2% 1985 13.5%
1986 8.9% 1987 11.7% 1988 11.3%
1989 4.2% 1990 3.9% 1991 9.2%
1992 14.3% 1993 13.9% 1994 13.1%
1995 11.0% 1996 9.9% 1997 9.2%
1998 7.8% 1999 7.6% 2000 8.4%
2001 8.3% 2002 9.1% 2003 10.0%
2004 10.1% 2005 11.3% 2006 12.7%
2007 14.2% 2008 9.6% 2009 9.2%
2010 10.6% 2011 9.5% 2012 7.9%
2013 7.8% 2014 7.3% 2015 6.9%
2016 6.7% 2017 6.8% 2018 6.6%
Source International Monetary Fund (IMF)
USA GDP Rate of Change
1980 – 2018
Year Amount Year Amount Year Amount
1980 (0.3%) 1981 2.5% 1982 (1.8%)
1983 4.6% 1984 7.2% 1985 4.2%
1986 3.5% 1987 3.5% 1988 4.2%
1989 3.7% 1990 1.9% 1991 (0.1%)
1992 3.5% 1993 2.8% 1994 4.0%
1995 2.7% 1996 3.8% 1997 4.4%
1998 4.5% 1999 4.8% 2000 4.1%
2001 1.0% 2002 1.7% 2003 2.9%
2004 3.8% 2005 3.5% 2006 2.9%
2007 1.9% 2008 (0.1%) 2009 (2.5%)
2010 2.6% 2011 1.6% 2012 2.2%
2013 1.8% 2014 2.5% 2015 2.9%
2016 1.6% 2017 2.4% 2018 2.9%
Source International Monetary Fund (IMF)
As you can see from the tables, China has dramatically outperformed the United States in terms of annualized GDP growth rate. Of course, in the 1980s, China was considered a developing country, while the United States was classified as a fully developed country in terms of its economy. Therefore, it’s difficult to make an “apples-to-apples” comparison. Nevertheless, there’s no denying the fact that China generated incredible levels of economic growth in the 1980s, 1990s, 2000s and 2010s.
For the past two decades, many economists have argued that China’s growth rate is unsustainable. More importantly, these same economists have postulated that the Chinese economy will eventually suffer a massive collapse, followed by several years of negative GDP. Of course, these dire forecasts have turned out to be completely wrong. These days, the general consensus among Wall Street economists concerning China is that the economy will easily outperform all other industrialized countries. However, everyone is in agreement that double digit growth rates similar to the 1980s, 1990s and 2000s is no longer feasible. In fact, this type of hyper growth would probably be harmful to the overall Chinese economy.
China’s current five-year plan covers the time period from 2020 through 2024. As you can see from the table, the IMF is forecasting an annual growth rate of 5.8%. These numbers fit perfectly with China’s plan to maintain a stable growth rate of 5% to 6% over the course of the next five years. In addition to stabilizing its GDP numbers, China’s economic team is in the early stages of transitioning to a consumer-based economy. Specifically, China is attempting to reduce its dependence on government economic programs designed to stimulate the economy. These government programs will be replaced with consumer spending at the retail level. This plan has a chance to be highly successful. It’s probably not a good idea to bet against China any time during the next decade.
China GDP Rate of Change
2019 – 2024 (Forecast)
Year Amount Year Amount Year Amount
2019 6.3% 2020 6.1% 2021 6.0%
2022 5.8% 2023 5.6% 2024 5.5%
Source International Monetary Fund (IMF)
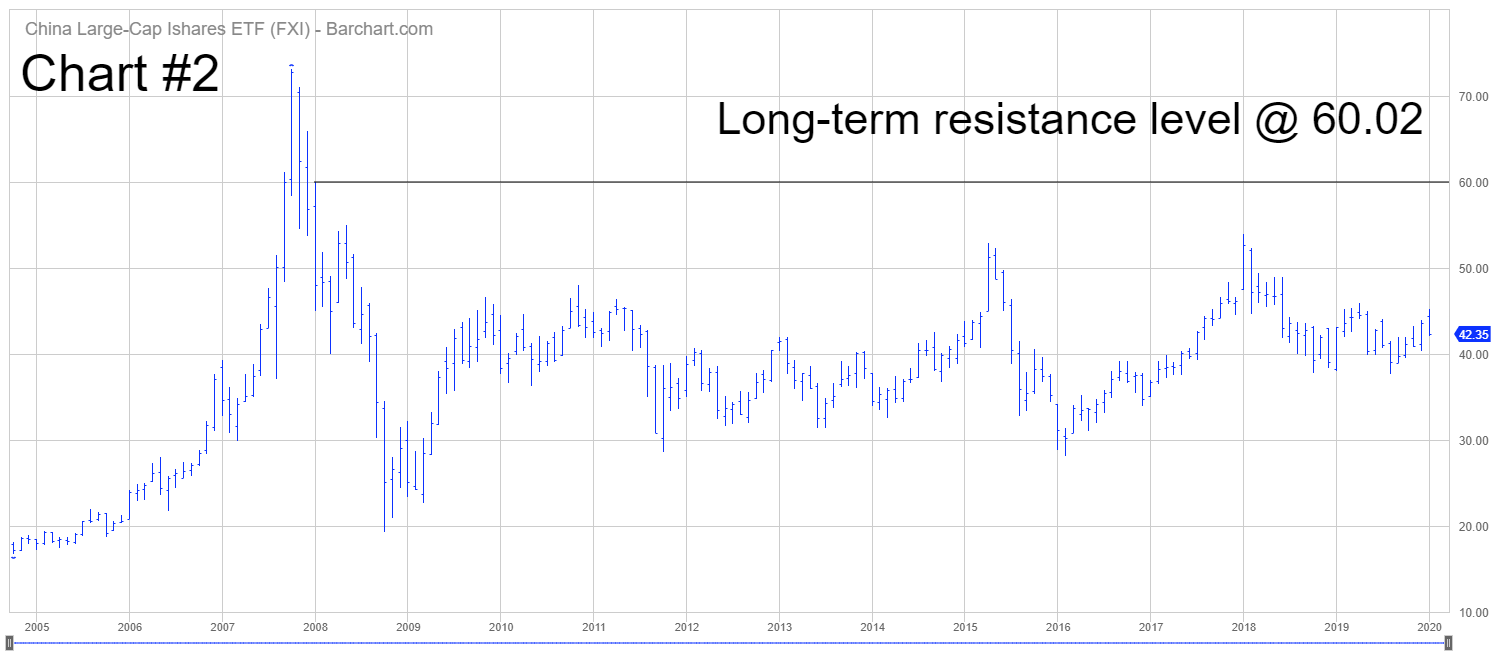
SHORT-TERM FXI China ETF CHART
Please review the 6-month chart of FXI (Chart #1). The short-term chart pattern is bearish. The next level of support is 39.13. Eventually, the chart pattern will flip in favor of the bulls. However, it’s never a good idea to pick a bottom. Instead, wait for the trend to reverse course. The important number to watch is a weekly close above 44.21.
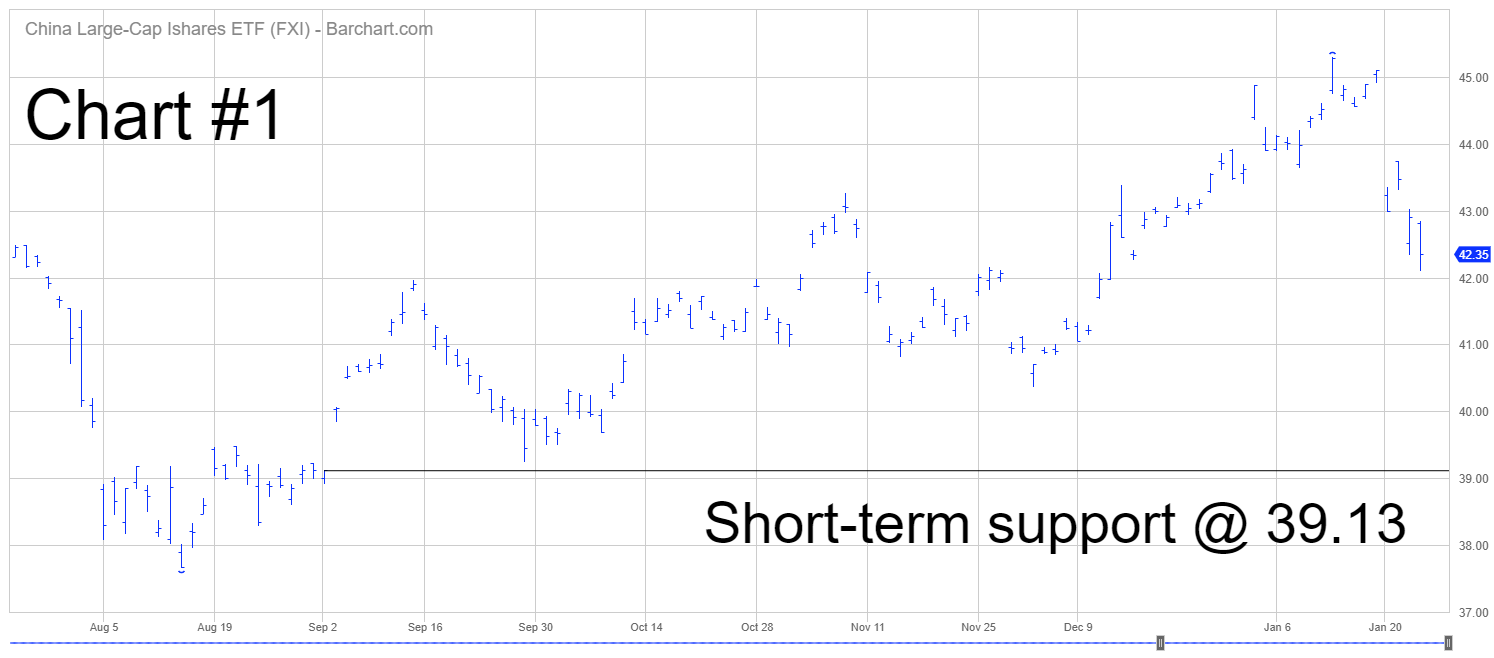
LONG-TERM FXI China ETF CHART
Please review the attached 15-year chart of FXI (Chart #2). The long-term chart is neutral. The important numbers to watch are 28.27 and 60.02. The most likely scenario is a bullish breakout to the upside.
