iShares MSCI BRIC ETF (BKF)
Key Statistics
Minor Support Level 36.23 Minor Resistance Level 48.48
Major Support Level 24.77 Major Resistance Level 58.76
Minor Buy Signal 50.94 Minor Sell Signal 34.80
Major Buy Signal 63.75 Major Sell Signal 18.19
BRIEF OVERVIEW – BRIC BKF ETF
In 2001, Wall Street economist Jim O’Neill coined the term “BRICs” when a financial reporter asked him to discuss his favorite investment theme for the upcoming decade. At the time, nobody in the Wall Street community had ever heard of the BRIC countries until O’Neill boldly predicted that these four countries would easily outperform North America and Europe (in terms of investment rate of return) during the decade of the 2000s. The four countries included Brazil, Russia, India and China.
Of course, the vast majority of Wall Street economists scoffed at O’Neill’s prediction that these four emerging market economies could generate enough GDP growth to outperform North America and Europe throughout the 2000s. O’Neill’s forecast was incredibly unpopular among the big investment houses on Wall Street.
O’Neill’s bold prediction turned out to be 100% correct, as the BRIC countries demolished North America and Europe from 2001 through 2010, in terms of investment performance.
Why did the BRICs generate such a substantial rate of return during the decade of the 2000s?
The answer can be summed up in one word, “Commodities.” The commodity markets enjoyed an incredibly powerful bull market throughout the first ten years of the new century. Many commodities tripled in price during this time period. The vast majority of emerging market countries (like the BRICs) have a commodity-based economy. In other words, their economies are heavily dependent on commodity activity. Thanks to the commodity bull market in the 2000s, the BRIC economies easily outperformed North America and Europe.
In addition to rising commodity prices, the BRIC countries enjoyed a declining US Dollar throughout most of the 2000s. The majority of BRIC economies’ debt is denominated in US Dollars. Therefore, it’s easier to service the debt when the value of the Dollar is declining against the country’s local currency.
Following the tremendous performance of the BRICs during the 2000s, this investment acronym became extremely popular on Main Street. It seemed as though the entire investment community wanted to invest in the BRIC countries as a new decade unfolded
beginning in 2011. However, the general public began investing in the BRIC countries at precisely the wrong time. Investors began pouring money into the BRICs, just as the massive commodity bull market was coming to an end. To make matters worse, the US Dollar formed an important bottom in 2011, and began a powerful new bull market.
During the past seven years (2011 – 2018), investing in the BRICs has been a poor decision. The average annual rate of return is 3.3% versus 11.5% for the S&P 500. Lately, investors have completely avoided the emerging market economies (particularly the BRICs). Of course, this probably means now is a great time to start investing in the BRICs. In an effort to determine the future direction of the BRICs, let’s examine these countries in more detail.
The iShares family of exchange traded funds (managed by BlackRock) introduced the MSCI BRIC ETF, with the objective of providing investors with exposure to the economies of Brazil, Russia, India and China. The ETF was launched on 12 November 2007, using the ticker symbol BKF. The ETF has 419 different holdings. The top five holdings include Tencent Holdings LLC, Alibaba Group Holdings ADR, China Construction Bank and China Mobile.
SHORT-TERM VIEW – BRIC BKF ETF
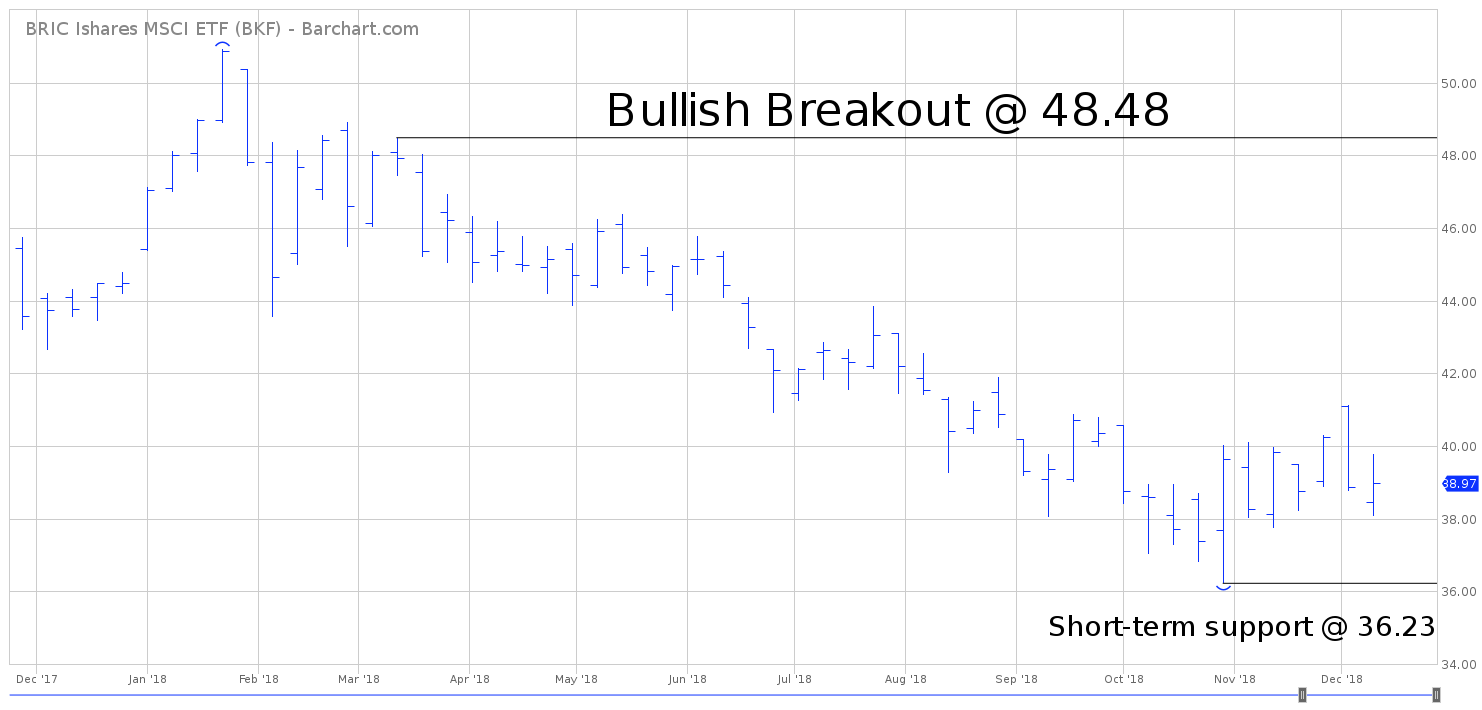
The bears are in control of the short-term momentum. BKF has been drifting lower since January, as the BRIC economies have struggled with a rising US Dollar and lackluster commodity prices. The next level of support is 36.23. The bulls need a weekly close above 48.48 in order to recapture the momentum.
LONG-TERM VIEW – BRIC BKF ETF
Despite the commodity bear market during the past seven years, the BRIC countries have generated solid economic performance. Each BRIC country has made an effort to reduce its dependence on commodities. This objective has been accomplished by shifting to a growth model based on consumer spending. During the next few decades, the BRICs will certainly benefit from consumer-driven growth because each country is expected expand its population rather aggressively. Please review the following table.
BRIC Countries
GDP & Population
Country Year GDP Population
Brazil 2013 2472.81 201.03
Brazil 2014 2455.99 202.77
Brazil 2015 1802.21 204.45
Brazil 2016 1793.99 206.08
Brazil 2017 2055.51 207.66
Russia 2013 2297.10 143.3
Russia 2014 2063.70 143.7
Russia 2015 1368.40 146.3
Russia 2016 1284.70 146.5
Russia 2017 1577.52 146.8
India 2013 1856.72 1223.58
India 2014 2039.10 1238.89
India 2015 2102.40 1254.02
India 2016 2274.20 1268.96
India 2017 2597.49 1283.60
China 2013 9607.22 1360.72
China 2014 10482.37 1367.82
China 2015 11064.67 1374.62
China 2016 11190.99 1382.71
China 2017 12237.70 1390.08
Source Trading Economics | GDP Billion US Dollars | Population Millions
The four BRIC countries represent 24% of global economic growth. More importantly, the BRIC economies are growing 2.5 times faster than the US economy. In terms of population, BRICs account for almost 40% of the world’s population. This will represent a huge tailwind as their economies continue to transition into a consumer-driven model. Here’s a startling statistic: By 2030, the middle class in India and China are forecasted to grow by 730 million. This is more than twice the entire United States population. The demographics are perfectly positioned for the BRIC countries as we enter a new decade in 2020.
In addition to favorable demographics and a pro-growth agenda, the BRIC countries could hit the “trifecta” if the commodity universe enters a new multi-year bull market. Commodities have been in a cyclical bear market since 2012. However, they are still in a secular bull market, which began in 2001. Based on current cycle analysis, the commodity sector is scheduled to begin a new cyclical bull market in 2020.
As we discussed earlier, many investors have “thrown in the towel” on the BRICs during the past 12 to 24 months. Unfortunately, they are probably liquidating their BRIC investments at the wrong time (just like they made a poor purchase decision in 2011 and 2012). It certainly appears as though the global equity markets are beginning to roll over to the downside. If this is the case, the BRICs could be one of the few bright spots during the next few years.
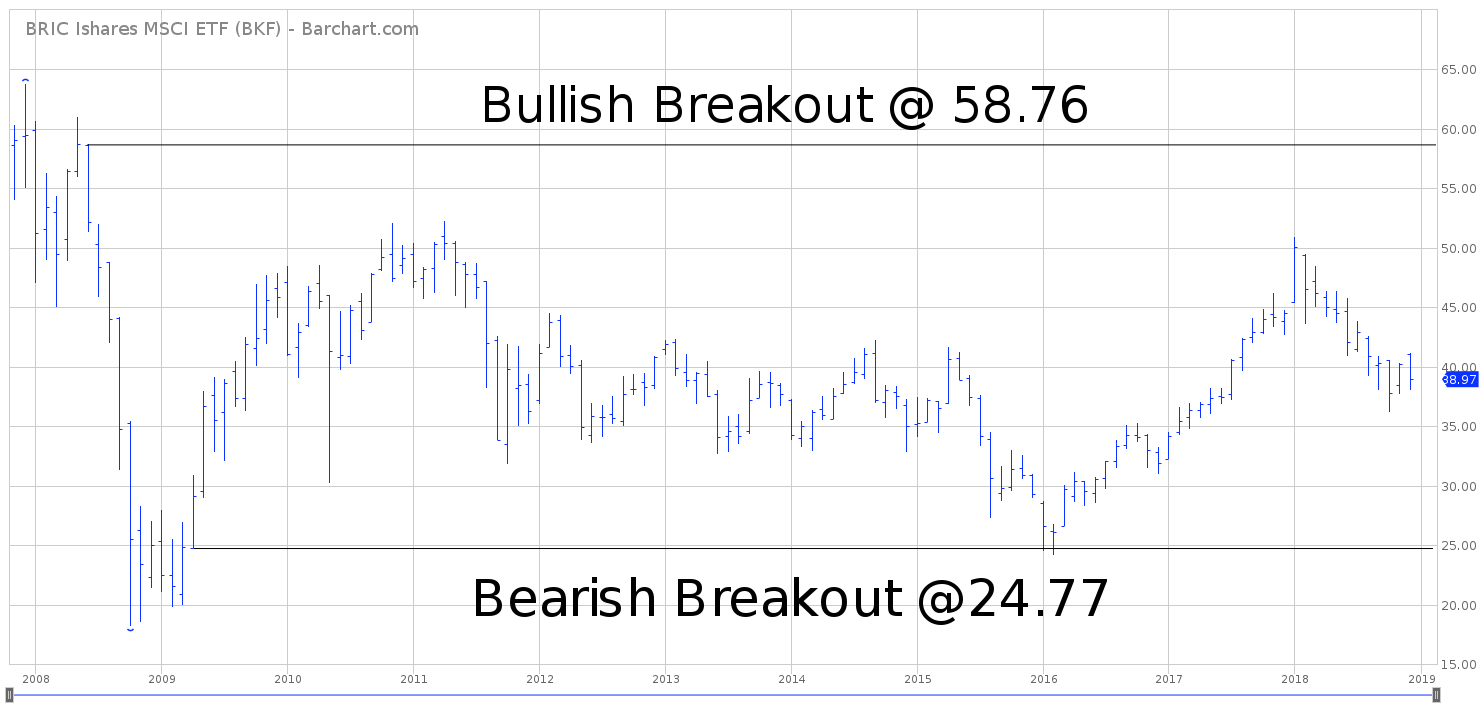
In regard to BKF, the long-term trend is neutral. Essentially, the ETF is stuck in the middle of its 11-year trading range between 24.20 and 52.25. In terms of momentum, the bulls will gain the upper hand on a weekly close above 58.76. The bears will capture the momentum on a weekly close below 24.77.
SHORT-TERM CHART – BRIC BKF ETF
Please review the attached 12-month chart of BKF. The bears are in control of the short-term trend. The next support level is 36.23. In order to recapture the trend, the bulls need a weekly close above 48.48. At least for the next few months, BKF will move in the direction of the overall stock market. It appears that the broad market has turned bearish. Therefore, the path of least resistance for BKF is probably to the downside.
LONG-TERM CHART -BRIC BKF ETF
Please review the 11-year chart of the BKF. This chart covers the entire trading history of the ETF. Based on the current chart pattern, BKF is currently hovering in neutral territory. The ETF suffered a brutal decline during the global financial crisis of 2008 and 2009. However, BKF came roaring back following a massive rally in the commodity markets in 2009 through 2011. Essentially, prices have been trading sideways for the past seven years. The eventual breakout could go in either direction. The numbers to watch are 24.77 and 58.76.